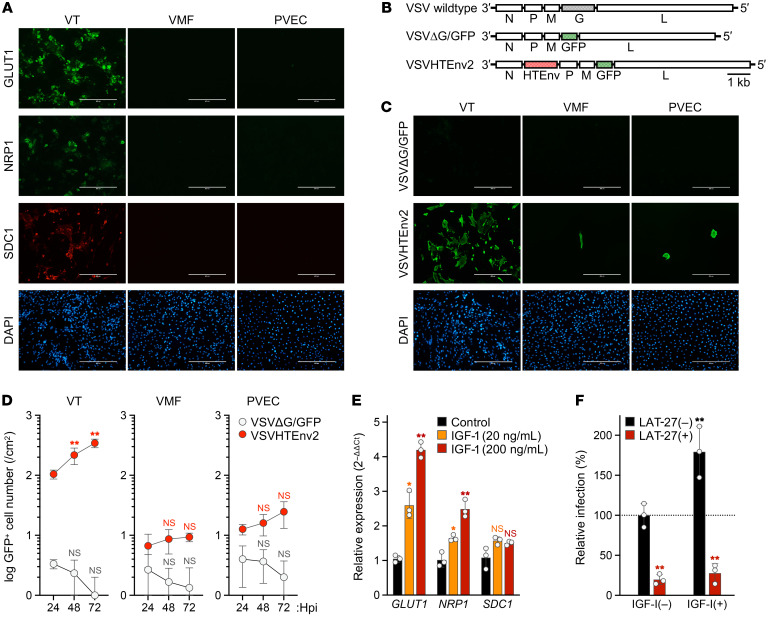
Figure 5. Evaluation of the susceptibility of human placental cells to HTLV-1 infection.
(A) Surface expression of HTLV-1 receptor molecules on primary placental cells. The expressions of GLUT1, NRP1, and SDC1 were confirmed by immunofluorescence (green and red), and cell nuclei were stained with DAPI (blue). (B) Schematic structure of rVSVs expressing GFP, with or without an HTLV-1 envelope (HTEnv), and the WT construct is shown. (C) HTLV-1 envelope–dependent infection of placental cells. Cells were infected with non–G-complemented VSVΔG/GFP or VSVHTEnv2. At 24 hours postinfection (hpi), GFP expression was evaluated to identify rVSV-infected cells (green) among all cells stained with DAPI (blue). In A and C, stained cells were observed by fluorescence microscopy. Scale bars: 400 μm. (D) Evaluation of viral growth kinetics. In rVSV-infected placental cells, the total number of GFP-positive cells was counted every 24 hours until 72 hpi. The results were calculated as the cell number per square centimeter. (E) Relative expression level of HTLV-1 receptor genes in VTs. Cells were stimulated with IGF-1 or mock-stimulated. The normalized expression levels for mock controls were set as 1 as a reference. (F) Increase in HTLV-1 susceptibility in IGF-1–stimulated VTs. Cells were initially stimulated with IGF-1 or mock-stimulated and then infected with non–G-complemented VSVHTEnv2 in the presence or absence of HTLV-1 envelope–specific neutralizing antibody (LAT-27). The total number of GFP-positive cells was counted, and the relative infectivity was calculated. In D–F, asterisks represent significant differences versus the data for 24 hpi, control, and LAT-27(–), respectively. *P < 0.05, **P < 0.01 by 2-way ANOVA followed by Dunnett’s multiple-comparisons test. Data are means ± SD of 3 independent experiments. VT, villous trophoblasts; VMF, villous mesenchymal fibroblasts; PVEC, placental vascular endothelial cells.

