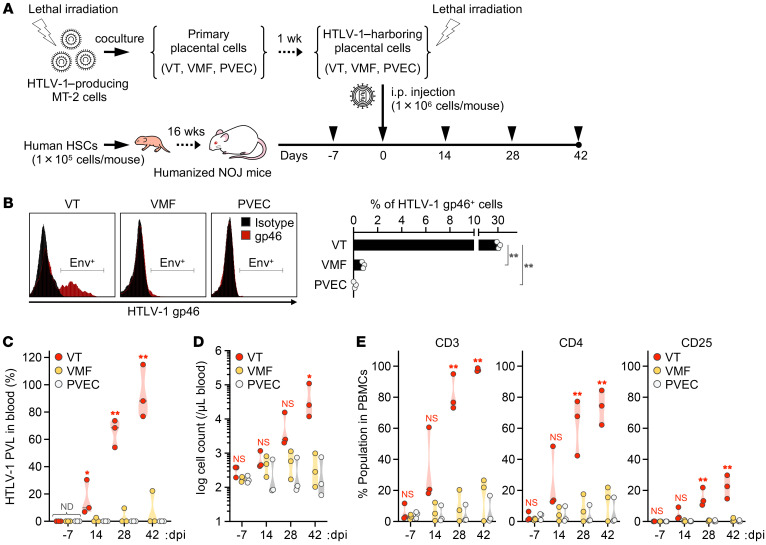
Figure 6. HTLV-1–infected trophoblasts induce de novo infection in humanized mice.
(A) Schematic of the experimental schedule. After humanization, 9 mice were inoculated i.p. with HTLV-1–harboring placental cells at 0 dpi (VT, n = 3; VMF, n = 3; PVEC, n = 3). Arrowheads indicate the time points of blood collection. All mice were observed carefully during the experimental period at 42 dpi. (B) Cell surface expression level of HTLV-1 envelope glycoprotein was analyzed in primary placental cells cocultured with MT-2 cells. The cells were stained with anti–HTLV-1 gp46 mAb or mouse IgG1 mAb as an isotype control. Representative cells (left) and the percentages of HTLV-1 gp46–positive cells (right) are shown. Data are means ± SD of 3 independent experiments. (C) Quantification of HTLV-1 PVL in the peripheral blood of inoculated mice. HTLV-1 PVL was determined by real-time PCR at 14, 28, and 42 dpi. One dot represents the result of an individual mouse. Undetected samples were given an arbitrary value of 100. (D and E) Human CD45+ leucocytes, CD3+ lymphocytes, total CD4+ T cells, and CD25+ T cells were routinely analyzed by flow cytometry. One dot represents the result of an individual mouse. The absolute numbers of human CD45+ leucocytes are shown in D. Frequencies of lymphocytes positive for the indicated marker are shown in E. CD3+ lymphocytes were gated to analyze the populations of CD4+ and CD25+ T cells. Asterisks represent significant differences versus the data for VTs in B, or PVEC-inoculated mice in C–E. *P < 0.05, **P < 0.01 by 1-way ANOVA followed by Dunnett’s multiple-comparisons test. ND, not detected.

