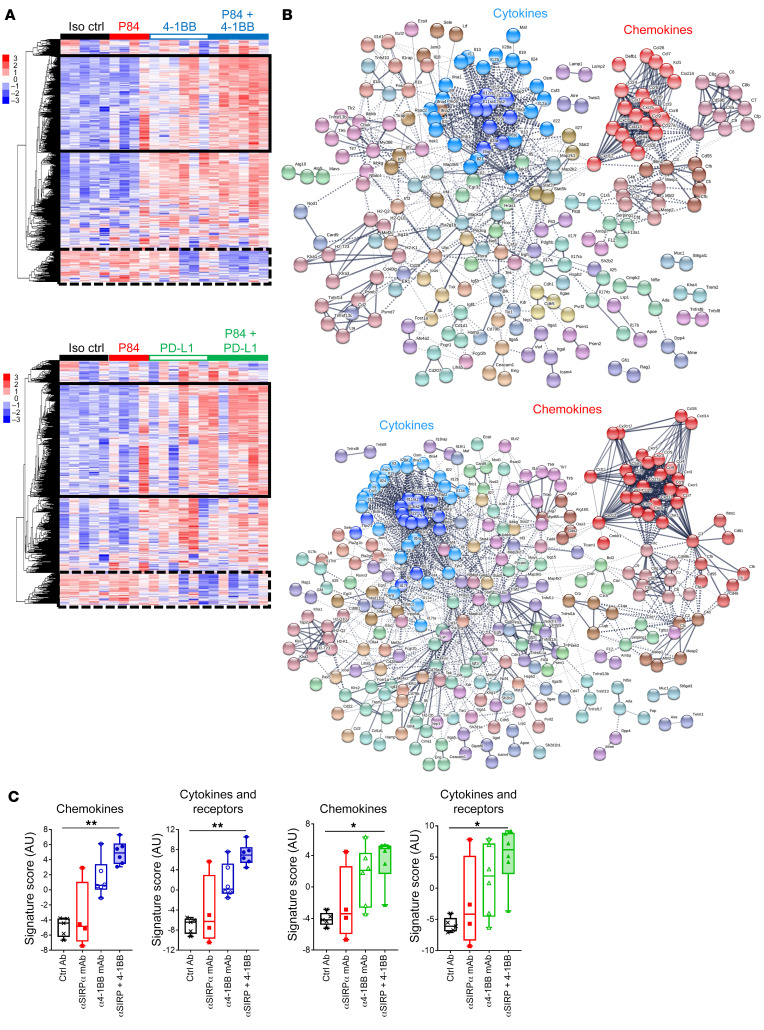
Figure 3. TME transcriptomic modifications after anti-SIRPα combination therapy in mouse.
Transcriptomic NanoString (PCIP panel) analysis of the liver of mice in the orthotopic Hepa1.6 HCC model 10 days after treatment initiation. Colors and symbols are the same as in Figure 2C. (A) nSolver relative gene expression analysis and heatmap representation (normalized to the median of control group) of mice treated with control Ab (n = 5), P84 anti-SIRPα mAb (n = 4), 4-1BB agonist ± P84 (upper panel, n = 6/group), or anti–PD-L1 mAb ± P84 (lower panel, n = 6/group). The solid-line rectangle surrounds the cluster of gene expression increased with P84 combination, while the dotted-line rectangle surrounds the cluster of gene expression decreased with P84 combination (see Supplemental Figure 8 for detailed list). (B) STRING protein-protein network analysis of upregulated gene cluster surrounded by solid-line rectangle in A. (C) Transcriptomic gene expression signature as annotated by NanoString according to the related function obtained using nSolver advanced analysis. *P < 0.05; **P < 0.01, unpaired Kruskall-Wallis test.

