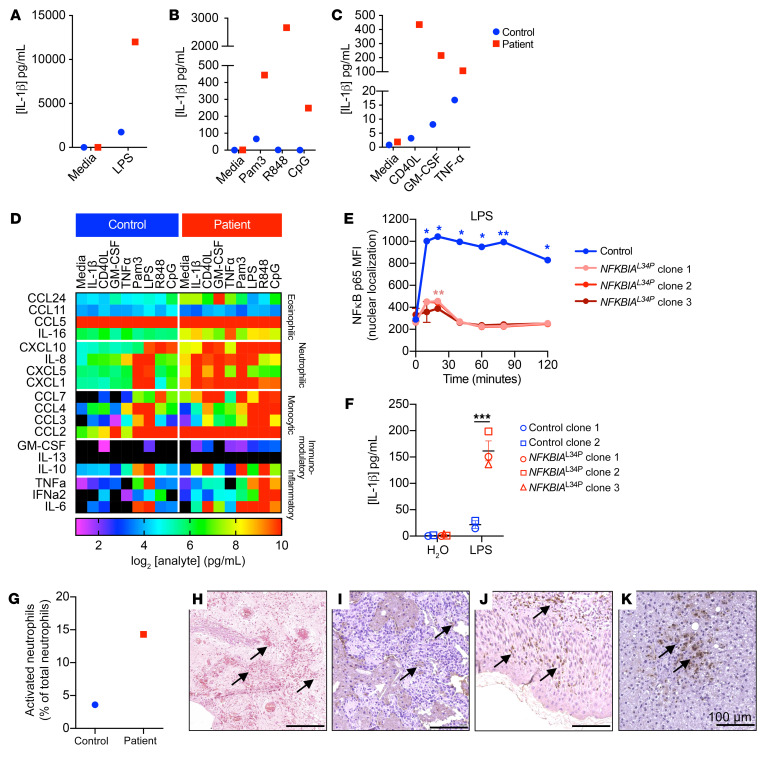
Figure 3. Activation and infiltration of granulocytes in mucosal tissue and enhanced IL-1β production in the patient.
(A–D) Whole blood from the patient at 8 months of age (red) and a healthy relative (blue) was either left unstimulated or stimulated for 18 hours with the TLR4 agonist E. coli LPS (100 ng/mL) (A), the TLR2 agonist Pam3Csk4 (1 μg/mL), the TLR7/8 agonist R848 (3 μg/mL), the TLR9 agonist CpG (10 μg/mL) (B), CD40L (3 μg/mL), GM-CSF (20 ng/mL), or TNF-α (15 ng/mL) (C). After incubation, supernatants from the cultures were assayed to detect the production of IL-1β (A–C) and chemokines involved in eosinophil, neutrophil, or monocyte chemotaxis, as well as immunomodulatory cytokines and inflammatory cytokines (D). Results are displayed as a heatmap of log2-transformed data, with range bar from no production (in black) to ≥10 log2 pg/mL. (E) Quantification of nuclear colocalization of p65 NF-κB with DNA stain in iMacs stimulated with LPS (100 ng/mL) for the indicated durations. (F) Luminex cytokine assay to detect IL-1β production in supernatants from 2 iMac lines derived from 2 control donors and 3 clonal lines of patient-derived iMacs after 24 hours stimulation with LPS (100 ng/mL). (G) Percentage of activated neutrophils from the patient at 8 months of age (red) and a healthy relative (blue). Graph displays activation as a loss of CD62L. (H) Tissue from the patient was carbol chromatrope-2R stained for eosinophilic infiltrate in the BCG-infected buttock abscess. (I–K) Mucosal tissue was stained for neutrophil elastase and counterstained with hematoxylin in the lung (I), skin (J), and liver (K). Black arrows in H–K indicate granulocyte infiltrate. Scale bars: 100 μm. (A–D and G) Data are from a single experiment. (E and F) Data are representative of 3 experiments and are shown as the mean ± SEM. *P < 0.05, **P < 0.01, and ***P < 0.001, by 2-way ANOVA with Holm-Šidák’s multiple-comparisons test.

