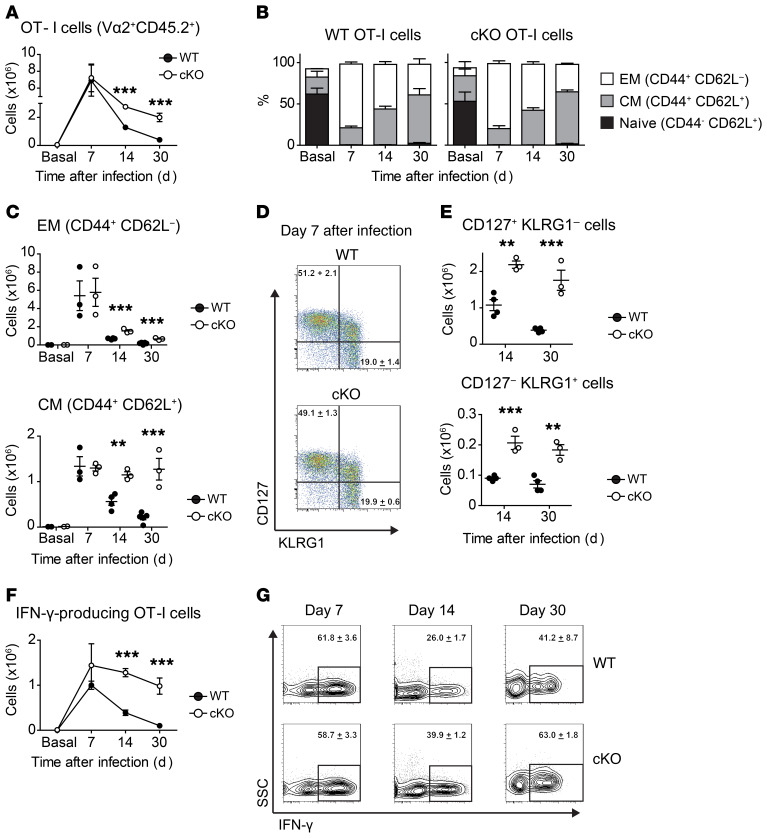
Figure 1. B55β regulates survival of activated T cells.
A quantity of 106 OT-I CD45.2+ Ppp2r2b+/+ Cd4.Cre+ (WT) or Ppp2r2bfl/fl Cd4.Cre+ (cKO) cells were adoptively transferred into WT CD45.1+ mice. The next day, 104 CFU of ovalbumin-expressing Listeria monocytogenes (LM-OVA) were i.v. injected into the recipient mice. (A) OT-I cells (CD45.2+ CD8+ Vα2+ Vβ5+) quantified in the spleens of recipient mice before infection (Basal) and at the indicated time points. (B) Frequency of naive (CD44– CD62L+), EM (CD44+ CD62L–), and CM (CD44+ CD62L+) cells within donor-derived OT-I cells. (C) OT-I EM and CM cell numbers in spleens of recipient mice are quantified at the indicated time points. Each symbol represents a mouse. Mean and SEM are indicated by horizontal lines. (D) Representative dot plots of CD127 (IL-7Rα) and KLGR1 expression on adoptively transferred OT-I cells at day 7 after infection with LM-OVA. Numbers in the dot plots represent the mean ± SEM of the indicated populations. (E) Absolute numbers of OT-I CD127+ KLGR1– and CD127– KLGR1+ cells in spleens of recipient mice. (F) Spleen cells from infected mice, stimulated ex vivo with SIINFEKL, in the presence of Brefeldin A. Results are expressed as absolute numbers of IFN-γ–producing OT-I T cells (mean ± SEM). (G) Representative contour plots from spleen cells stimulated with SIINFEKL (gated in CD45.2+ CD8+ Vα2+ Vβ5+ donor-derived OT-I cells). Numbers represent mean ± SEM of the IFN-γ+ populations. Results from 1 representative of 3 experiments (n = 3–5 mice/group) are shown (A–G). For comparison of the means, unpaired 2-tailed t tests were used in A, C, E, and F; **P ≤ 0.01, ***P ≤ 0.001.

