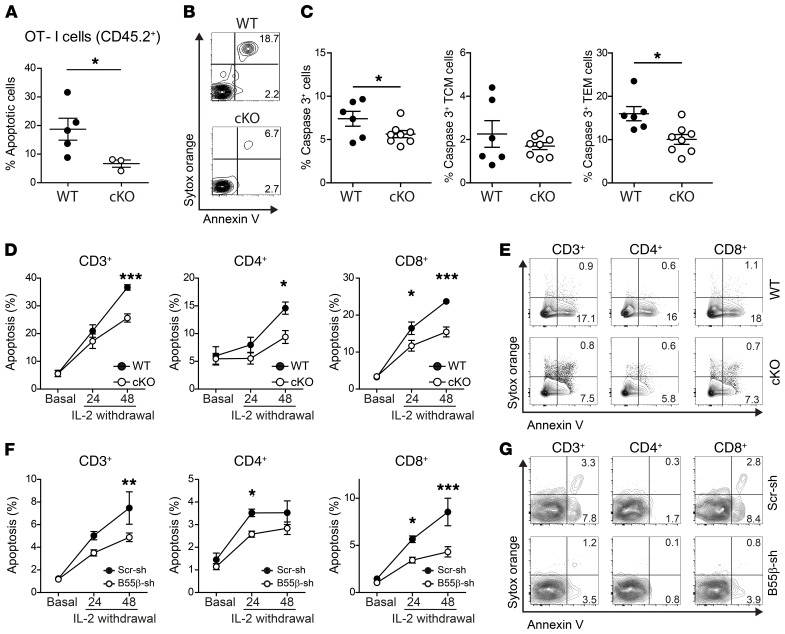
Figure 2. B55β is necessary for CWID.
(A–C) OT-I CD45.2+ Ppp2r2b+/+ (WT) or Ppp2r2bfl/fl (cKO) cells were adoptively transferred into CD45.1+ mice. The next day, LM-OVA was injected. After 30 days (A and B) or 14 days (C), the percentage of apoptotic OT-I cells (CD45.2+ CD8+ Vα2+ Vβ5+) was quantified as Annexin V binding (A and B) or caspase-3 activation (C) in spleens. Cumulative data from 2 experiments (n = 3–8 mice/group) are shown in A and C. *P ≤ 0.05, unpaired 2-tailed t test. Representative contour plots of OT-I cells (B). Numbers represent mean of the indicated populations. (D and E) T cells from Ppp2r2b+/+ Cd4.Cre+ (WT) or Ppp2r2bfl/fl Cd4.Cre+ (cKO) mice were stimulated in vitro with anti-CD3 and anti-CD28 (2 μg/mL). Fresh RPMI and IL-2 (100 U/mL) were replenished every 48 hours. At day 10, cells were counted and resuspended in fresh RPMI (106 cells per mL) devoid of IL-2, in the presence of a neutralizing anti–IL-2 antibody (5 μg/mL). Apoptosis was quantified before (basal) and after 24 and 48 hours of cytokine withdrawal. Results are presented as mean ± SEM. Cumulative results from 3 independent experiments (n = 2–4 mice/group/experiment) are shown. *P ≤ 0.05, ***P ≤ 0.001 (2-way ANOVA with Bonferroni’s posttest). Representative contour plots of WT and cKO cells, 48 hours after IL-2 withdrawal (E). (F) Human T cells were activated and infected in vitro as detailed in Supplemental Figure 7. Apoptosis was quantified after IL-2 withdrawal in lentiviral-infected cells (mCherry+) at the indicated time points. Results are presented as mean ± SEM. Cumulative results from 4 experiments (n = 1/experiment). *P ≤ 0.05, **P ≤ 0.01, ***P ≤ 0.001 (2-way ANOVA with Bonferroni’s posttest). (G) Representative contour plots at 48 hours after IL-2 deprivation.

