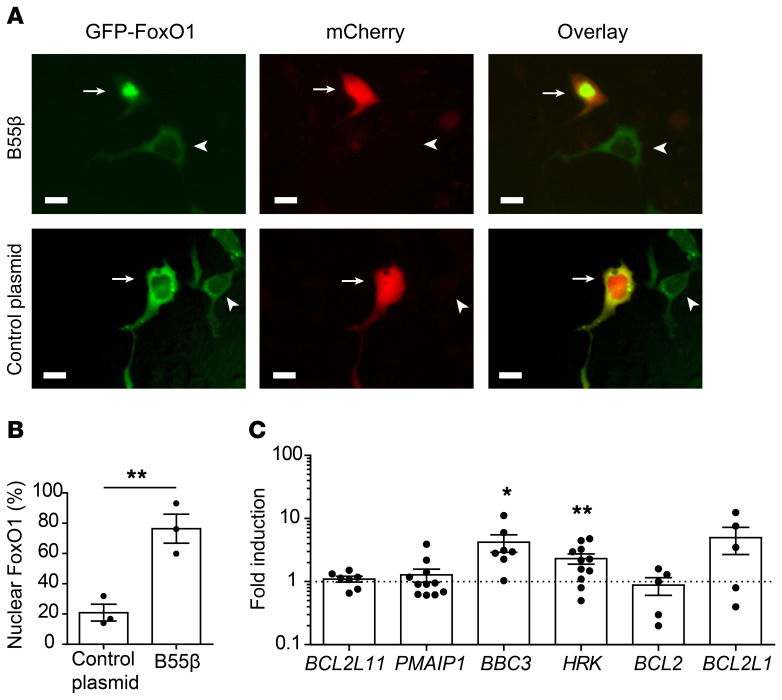
Figure 5. B55β activates FoxO1 and promotes HRK transcription.
(A) MCF-7 cells were transfected with a plasmid encoding a GFP-FoxO1 fusion protein and either pLVX-PPP2R2B-IRES-mCherry or pLVX-mCherry, and FoxO1 localization was evaluated by fluorescence microscopy. Representative images are shown. Arrows indicate cells transfected with both plasmids; arrowheads indicate cells transfected only with GFP-FoxO1. Scale bars: 5 μm. (B) Cumulative data (mean ± SEM) of 3 independent experiments are shown (each dot represents 1 experiment). In each experiment, 100 cotransfected cells were evaluated. For comparison of the means, unpaired 2-tailed t test was used; **P ≤ 0.01. (C) Human T cells were infected with control- or B55β-encoding lentiviruses following the procedure depicted in Figure 4. Sixteen hours later, expression of the indicated genes was quantified by real-time PCR and normalized to ACTB. Cumulative data of 8 independent experiments expressed as mean ± SEM fold induction against empty virus (indicated by the broken line). Each dot represents 1 sample. For comparison of the means, unpaired 2-tailed t test was used; *P ≤ 0.05, **P ≤ 0.01.

