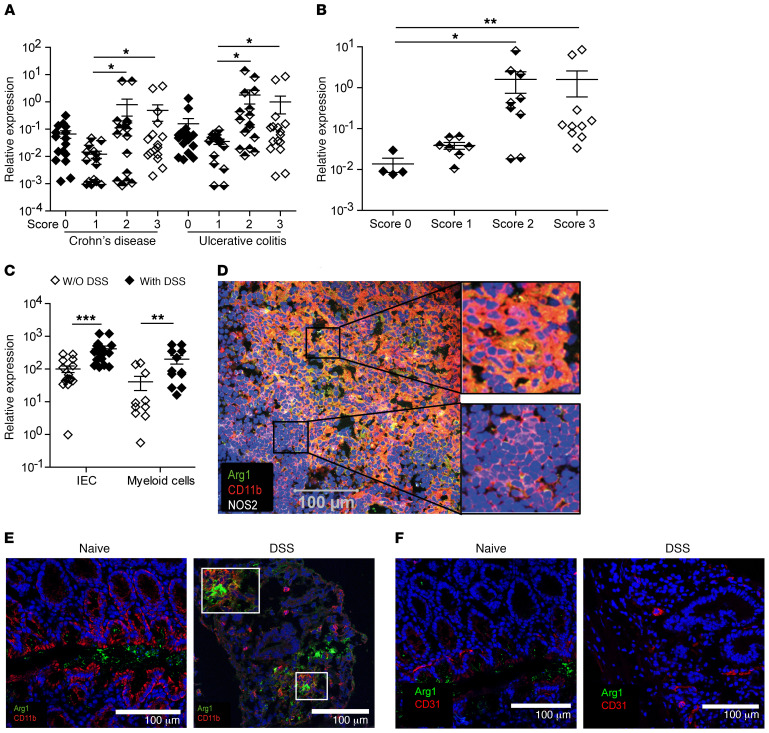
Figure 1. Expression of Arg1 in human IBD and mouse DSS-induced colitis.
(A–C) Using qPCR, Arg1 expression was evaluated in intestinal tissue biopsies from CD and UC patients (A), sigmoid tissue biopsies from UC patients (B), or in IECs or myeloid cells purified from WT mice before and after DSS application (C). The ratio of Arg1 mRNA copies relative to Hprt copies was calculated in the indicated cells and tissues of 14–16 CD and UC patients (A), 4–10 UC patients (B) for each score and 10–16 individual female mice (C). The relative increase in Arg1 copy numbers in tissues of patients for each score and of naive versus DSS-treated WT mice is displayed. Depending on the number of groups and the distribution of data, data were analyzed using 1-way ANOVA followed by Bonferroni’s post hoc test for pairwise comparisons if the former was significant, or for multiple comparisons, the Mann-Whitney U test or the Kruskal-Wallis test followed by Dunn’s post hoc test was used if the former was significant. *P ≤ 0.05; **P < 0.01; ***P < 0.001. Error bars indicate SD of the mean. (D–F) Using confocal laser microscopy, Arg1 expression was determined in mLNs (D) and in total colonic tissue of naive and DSS-treated SPF B6 mice (E and F). Serial sections from mLNs (D) or colonic lesions (E and F) were stained for Arg1 (green), NOS2 (white), CD11b (red), or CD31 (red). Nuclei were stained with DAPI (blue). Scale bars: 100 μm. Original magnification, ×100.

