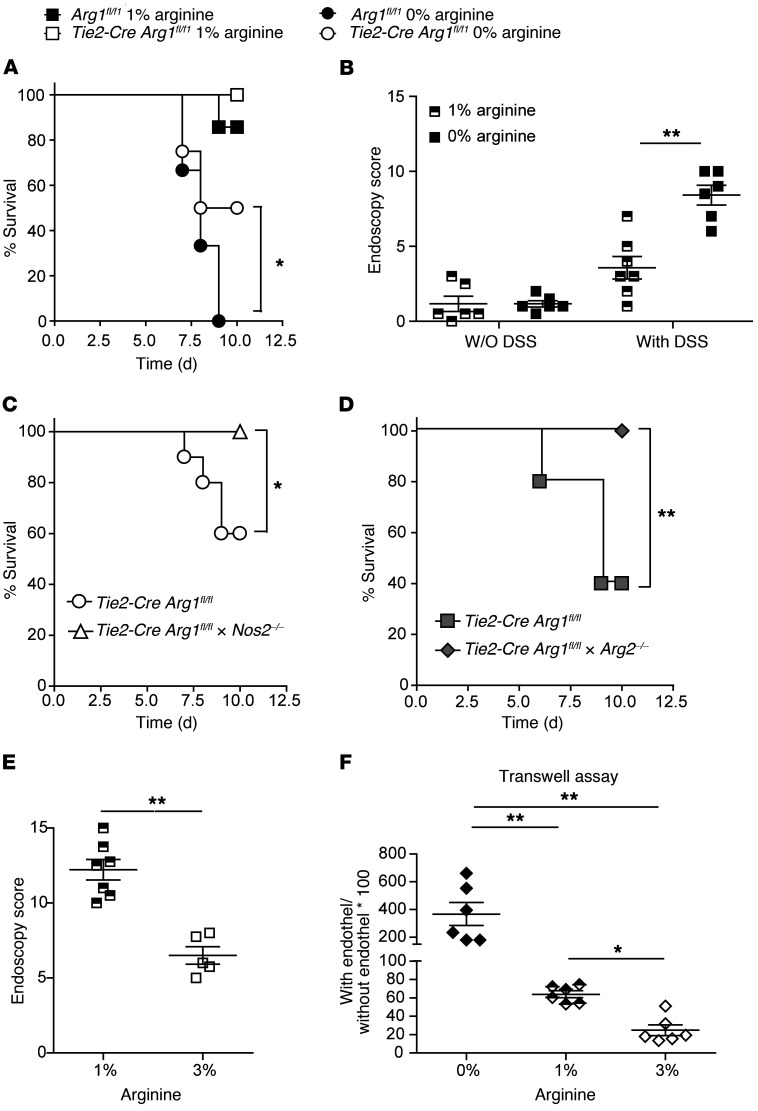
Figure 6. Arg1-dependent depletion or nutritional restriction of l-arginine exacerbates colitis and endothelial permeability.
(A, C, and D) The survival curves for 12–14 (A), 10 (C), and 8–15 (D) individual mice of the indicated mouse strains are displayed. Data shown in panels C and D is for mice on an l-arginine–free chow. Kaplan-Meier survival curves were plotted for each cohort, and statistical significance was determined by log-rank test. *P ≤ 0.05; **P < 0.01. (B and E) The severity of colitis in Tie2-Cre Arg1fl/fl mice fed with control or l-arginine–free chow (B) as well as in WT mice fed control (1% l-arginine) or l-arginine–enriched chow (3% l-arginine) (E) was monitored by endoscopy. The means (± SD) of the endoscopic scores from 5–7 individual knockout female mice in each cohort are displayed. (F) Macrophage transmigration across an endothelial layer in the presence of the indicated l-arginine concentrations was measured with Transwell chambers (n = 6). Data were analyzed using the Mann-Whitney U test or the Kruskal-Wallis test followed with Dunn’s multiple comparisons if the former was significant. *P ≤ 0.05; **P < 0.01. Error bars indicate SD of the mean.

