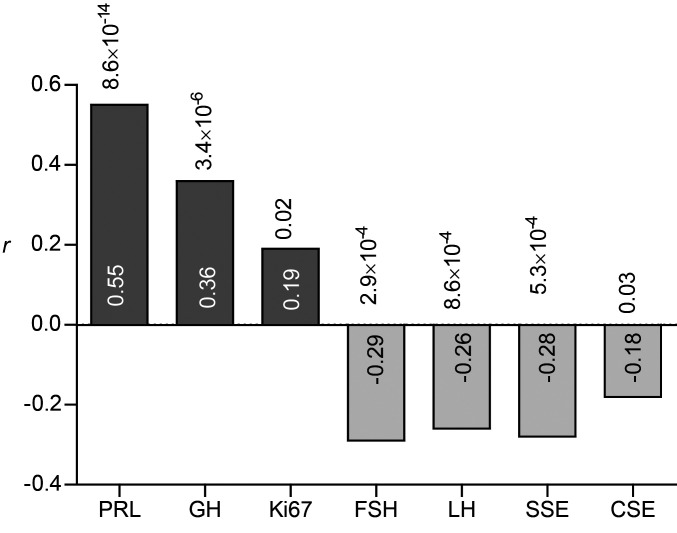
Figure 2. Correlation between SCNA score and phenotypic adenoma characteristics.
The correlation between SCNA score and phenotypic adenoma characteristics was assessed by immunostaining (hormones and Ki67) or MRI (suprasellar extension [SSE] and cavernous sinus extension [CSE]). Spearman’s rank-order correlation is shown inside the bars; P values are shown above each bar. Dark gray bars indicate a positive correlation; light gray bars indicate a negative correlation. n = 159.

