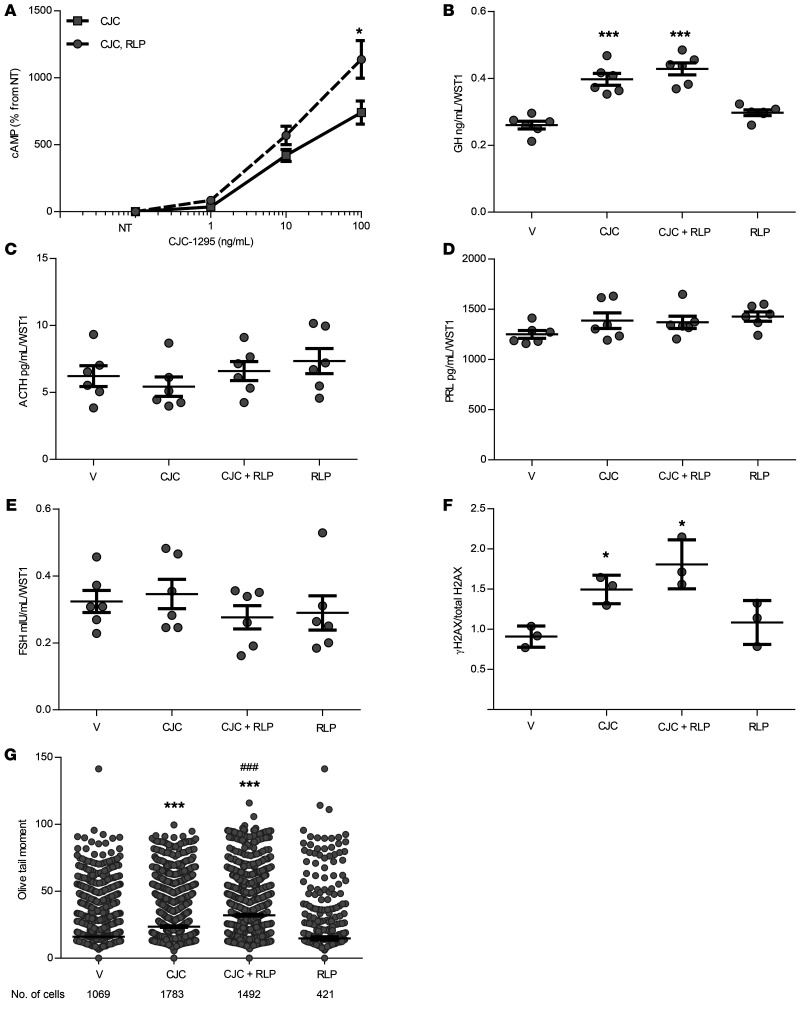
Figure 6. CJC-1295 and rolipram actions in C57BL/6 normal mouse primary pituitary cultures.
(A) Dose-dependent response of intracellular cAMP to 30 minutes of treatment with CJC-1295 (CJC), with or without 1 μM rolipram. Results are graphed as the percentage of untreated cultures (NT). n = 6/treatment group. *P ≤ 0.05, by 2-way ANOVA with Bonferroni’s correction. (B) GH, (C) ACTH, (D) PRL, and (E) FSH supernatant concentrations after 16 hours of treatment with vehicle, 10 ng/mL CJC-1295, cotreatment with 10 ng/mL CJC-1295 and 1 μM rolipram, or 1 μM rolipram alone, normalized to WST1. n = 6 per treatment group. (F) Quantitative presentation of Western blot depicting the change in γH2AX levels normalized to total H2AX after 16 hours of treatment as above. Results were derived from 3 separate wells. Band intensities were calculated by ImageJ. The full panel is shown in Supplemental Figure 9. (G) Comet assay results depicting Olive tail moment measured after 16 hours of treatment as above. Results were pooled from 2 experiments. The number of cells analyzed by a blinded observer is indicated. Results are presented as the mean ± SEM (vehicle, 16.1 ± 0.7; CJC-1295, 23.6 ± 0.6; CJC-1295 plus rolipram, 32.1 ± 0.7; rolipram, 14.8 ± 1.2). *P ≤ 0.05 versus vehicle and ***P ≤ 0.001 versus vehicle; ###P ≤ 0.001 versus CJC-1295, by 2-tailed, unpaired t test with Bonferroni’s correction. The experiments were performed twice.

