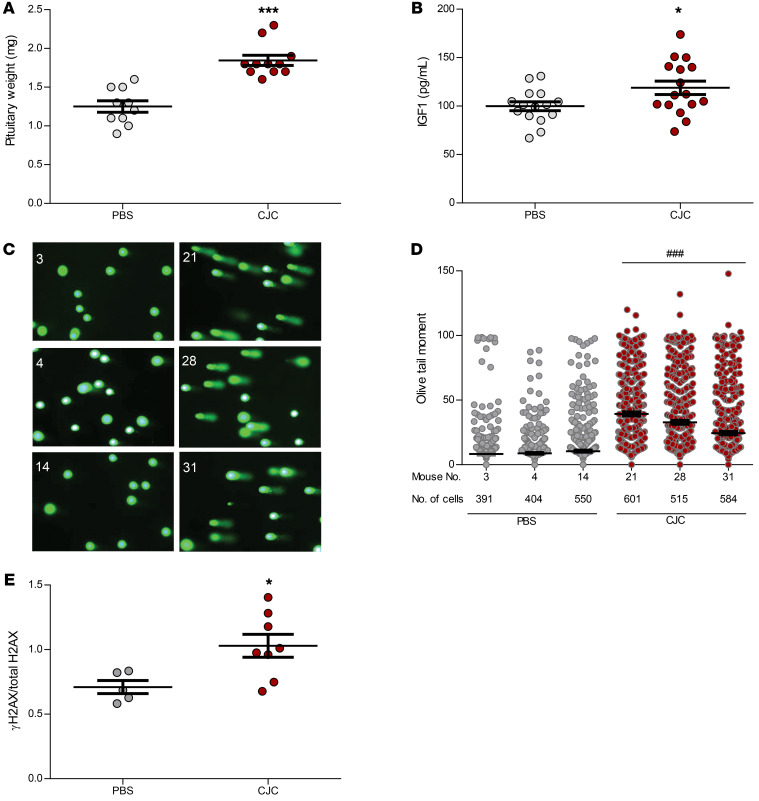
Figure 9. CJC-1295 treatment in vivo.
Four-month-old male C57BL/6 mice were injected s.c. with PBS (n = 15) or 10 μg/kg CJC-1295 (n = 16) 3 times per week for 8 weeks. (A) Pituitary weight (mg) in PBS-treated mice (n = 9) and CJC-1295–treated mice (n = 10). (B) Serum IGF1 levels (pg/mL) in PBS-treated mice (n = 15) and CJC-1295–treated mice (n = 16). Results are presented as the mean ± SEM. *P ≤ 0.05 and ***P ≤ 0.001 versus PBS, by 2-tailed, unpaired t test with Bonferroni’s correction. (C) Comet assay and tail appearance in representative mice. Images on the left are of PBS-treated mice (mice 3, 4, and 14); images on the right are of CJC-1295–treated mice (mice 21, 28, and 31). One image from each mouse is presented. Cells from each mouse pituitary gland were plated on 3 slides, and 61–89 images were taken for each mouse (original magnification, ×20), depending on the number of cells visualized. (D) Comet assay results depicting Olive tail moment for the 6 mice presented in C. The number of cells analyzed by a blinded observer is indicated. Results are presented as the mean ± SEM (mouse 3, 8.3 ± 0.9; mouse 4, 8.8 ± 0.7; mouse 14, 10.5 ± 0.8; mouse 21, 39.3 ± 1.5; mouse 28, 32.9 ± 1.5; mouse 31, 24.4 ± 1.2). ###P ≤ 0.001 for each CJC-1295–treated mouse versus each PBS-treated mouse, by 1-way ANOVA. (E) Quantitative analysis of γH2AX change normalized to total H2AX in PBS-treated mice (n = 5/7) versus CJC-1295–treated mice (n = 8/8), as presented in Supplemental Figure 11. Two mice were excluded from the PBS-treated group, as described in Results. Band intensities were calculated with ImageJ. Results are presented as the mean ± SEM. *P ≤ 0.05 versus PBS, by 2-tailed, unpaired t test with Bonferroni’s correction. The experiment was performed twice.

