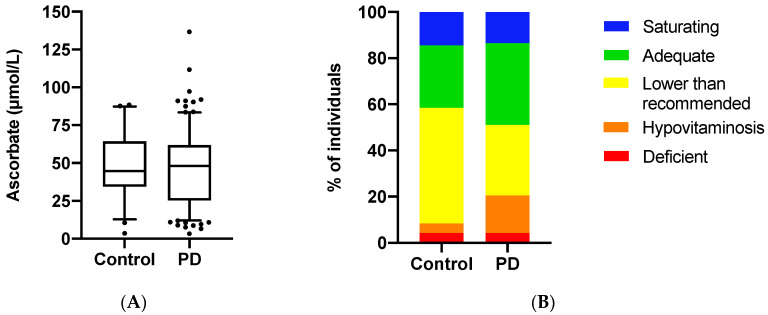
Figure 1.
Ascorbate status of the study population. (A) Box plots show medians in plasma ascorbate concentrations in the Parkinson’s disease (PD) group (n = 214) and control group (n = 48). Boundaries are set at the 25th and 75th percentiles, whiskers at 5th and 95th percentiles, outliers are indicated by symbols. Mean plasma ascorbate concentrations were not significantly different between the two groups (p = 0.74). (B) Proportion of participants in different ascorbate categories. Individuals within the Parkinson’s disease (PD) and control groups were classified as having saturating (>70 μmol/L), adequate (>50 μmol/L), lower than recommended (<50 μmol/L), hypovitaminosis C (<23 μmol/L), and deficient (<11 μmol/L) plasma ascorbate concentrations [30]. Categories are shown as percentages. The PD group had a significantly higher proportion of hypovitaminosis C (p = 0.048).

