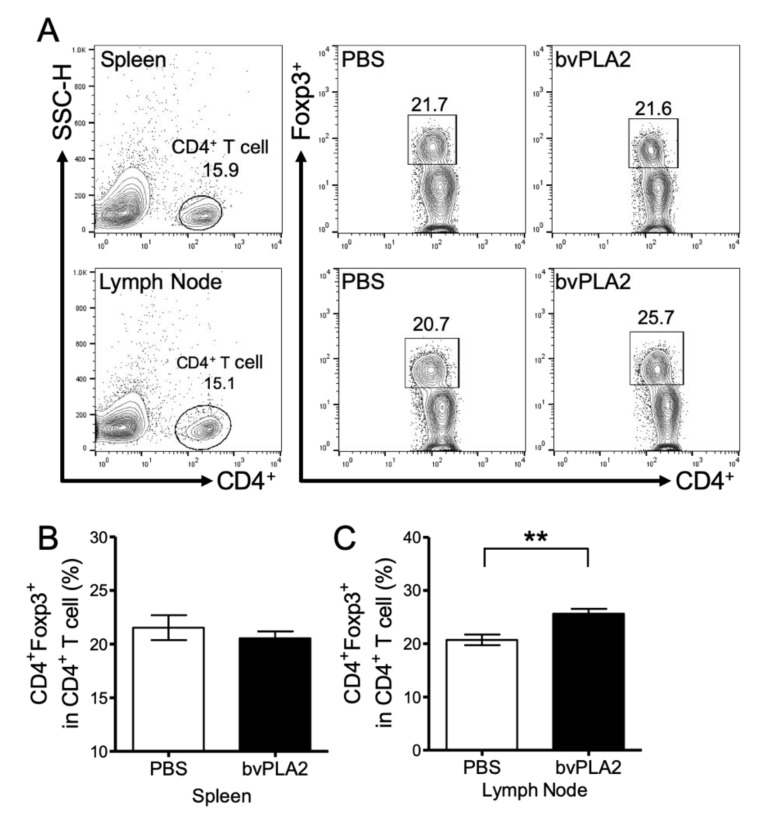
Figure 2.
Effect of bvPLA2 on CD4+ Foxp3+ regulatory T cells. Single cells from the spleen and peripheral lymph node were measured using a fluorescence activated cell sorting (FACS) Calibur flow cytometer. (A) Representative flow cytometry plots from spleen (upper panel) and lymph node (lower panel) in ApoE-/- mice. Doublets and small multiplets were filtered by side-scatter height (SSC-H), and only CD4+ cells were gated. The cells were gated on Foxp3+ cells and analyzed. Number shows the percentage of CD4+ cells (left, upper and lower panel) out of total cells and Foxp3+ cells (right, upper and lower panel) in CD4+ cells with treatment of PBS and bvPLA2. Graphs show the percentage of CD4+ Foxp3+ Treg cells in CD4+ T cells in the spleen (B) and lymph node (C). The data are displayed as the means ± SEM. Statistical analyses were conducted with Student’s unpaired t test; **, p < 0.01 vs. the PBS group; n = 11.

