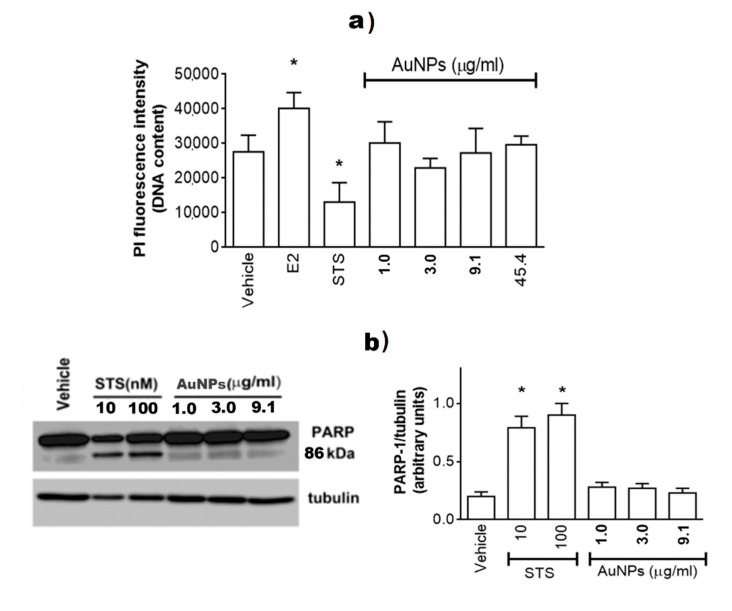
Figure 6.
Analyses of cellular DNA content obtained from propidium iodine assay (PI). (a) MCF-7 cells were treated for 48 h with either vehicle (ethanol/DMEM, 1/10) or E2 (10 nM) or staurosporine (100 nM; STS) or with different AuNPs concentrations. Data are means ± SD of six different experiments. (*) p < 0.001 was calculated with Student’s t test versus vehicle. (b) Western blot (left) and densitometric analyses (right) of PARP-1 cleavage in MCF-7 cells. Cells were treated with staurosporine (10 or 100 nM, STS) or with different AuNPs concentrations. The amount of cleaved protein was normalized by comparison with α-tubulin levels. Data are the mean ± SD of five different experiments. (*) p < 0.001 was determined with Student t-test with respect to the vehicle.

