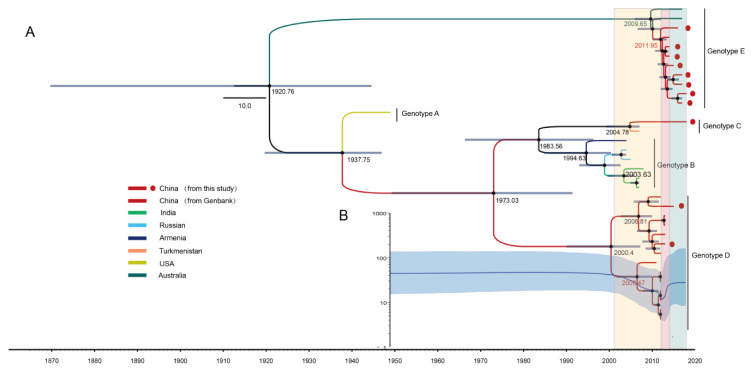
Figure 2.
(A) The maximum clade credibility (MCC) phylogenetic tree generated using the Markov chain Monte Carlo (MCMC) method based on the complete VP1 sequences of 34 CV-A8 variants and coloured according to different countries. The scale bar represents time in years. The tree was node-labelled with inferred dates of lineage splits. Each genotype is noted on the right. (B) Bayesian skyline plot of the 34 CV-A8 VP1 region sequences, reflecting the relative genetic diversity from 1949 to 2018. The x-axis is the time scale (years), and the y-axis is the effective population size. The solid line indicates the median estimates, and blue shading indicates the 95% highest posterior density. The three stages of effective population size are shaded with light yellow, rose and aqua.

