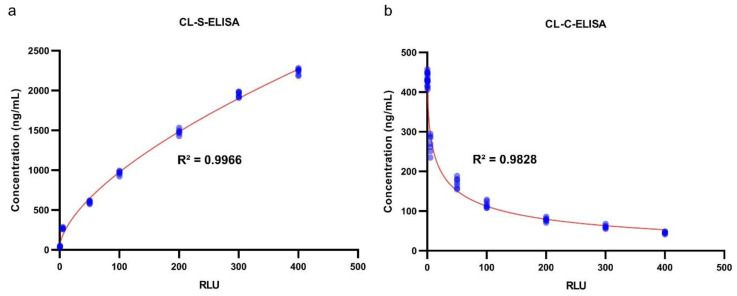
Figure 2.
Calibration curves of CL-S-ELISA (a) and CL-C-ELISA (b). Samples used to generate calibration curves (seven replicates at each level of A. simplex antigen concentration, n = 63) were heated for 60 min at 100 °C. The concentration (in ng/mL) of Anisakis antigen used for spiking trout samples versus Relative Light Units (RLU) observed in assays were plotted using the GraphPad Prism software (GraphPad Software, ver. 8.3.1, La Jolla, CA, USA). Four-parameter logistic regression was used for curve fitting and calculating the coefficient of determination (R2) using the GraphPad Prism software. Red lines show fitted curves and blue points show the results of individual samples.

