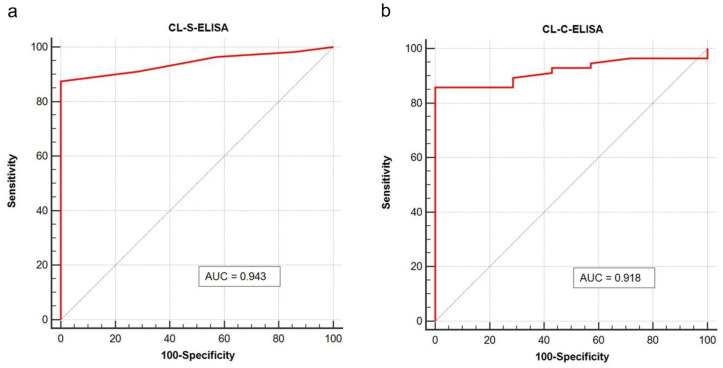
Figure 4.
Receiver operating characteristic curve (ROC) plots with calculated Area Under the Curve (AUC) of CL-S-ELISA (a) and CL-C-ELISA (b). Trout samples (heated extracts spiked with A. simplex antigen) used to validate assays (n = 63) were subjected to this analysis. The Medcalc software (MedCalc Software Ltd., ver. 19.3, Mariakerke, Belgium) was used to performed calculations and plotting.

