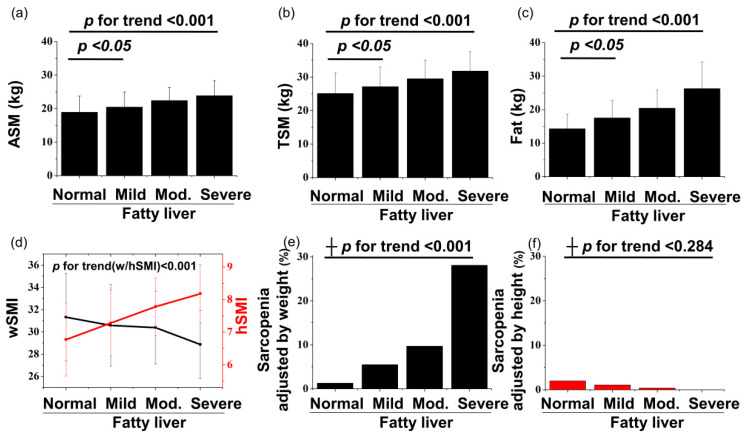
Figure 3.
Graphs of ASM (a), TSM (b), and fat (c) versus the severity of fatty liver. Graphs of skeletal muscle index (d) and sarcopenia prevalence (e and f) versus the severity of fatty liver, according to different adjusting methods. The p for trend of continuous and categorical variables was calculated using ANOVA and ┼ Fisher’s Exact test, respectively. p values between the normal and mild fatty liver severity groups for ASM, TSM, and fat were calculated using t-test.

