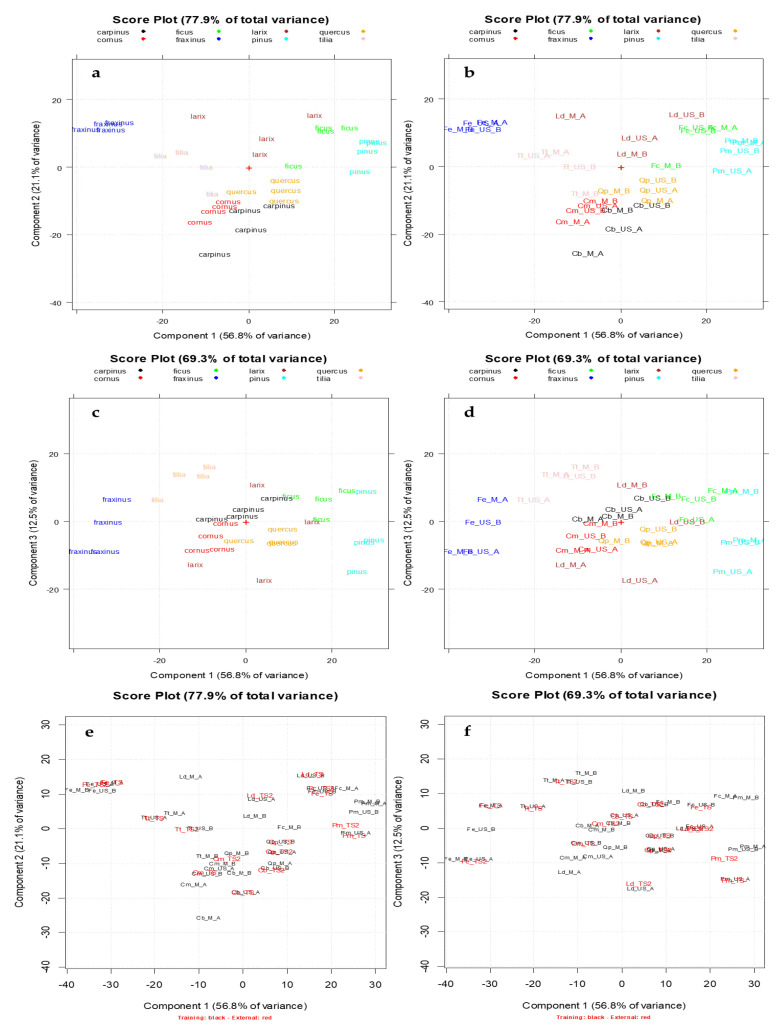
Figure 3.
The scores plots of the UV–Visible absorbances data matrix A32,601. Each vegetable species is reported with a different color (Carpinus betulus L.: black, Cornus mas L.: red, Ficus carica L: green., Fraxinus excelsior L.: blue, Larix decidua Mill.: brown, Pinus montana Mill.: light blue, Quercus petraea (Matt.) Liebl.: orange, Tilia tomentosa Moench: pink). (a) PC1-PC2 score plot with BDs categorized according to the vegetable species; (b) PC1-PC2 score plot with BDs categorized according to their identification code (Table 2); (c) PC1-PC3 score plot with BDs categorized according to the vegetable species; (d) PC1-PC3 score plot with BDs categorized according to their identification code (Table 2); (e) PC1-PC2 score plot obtained projecting the external test set samples (highlighted in red); (f) PC1-PC3 score plot obtained projecting the external test set samples (highlighted in red).

