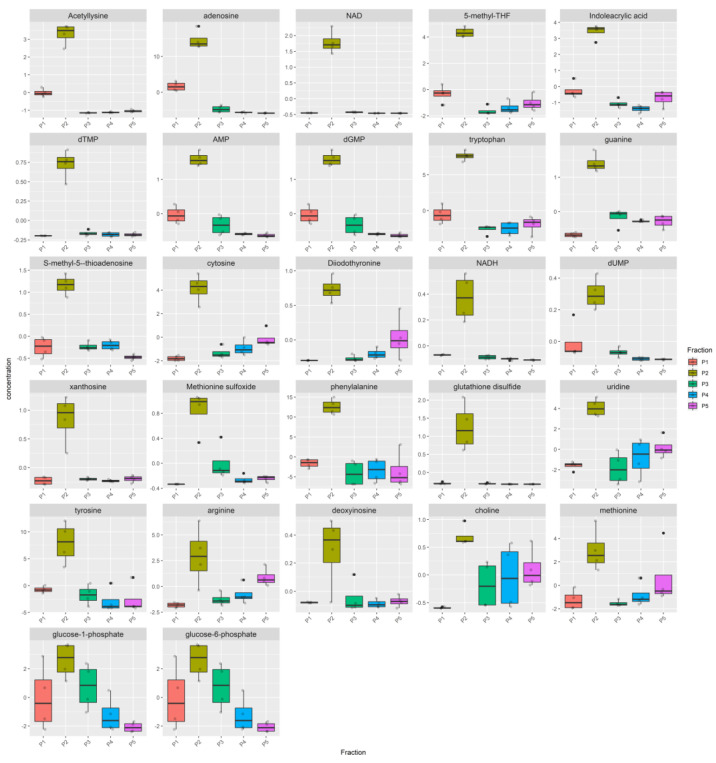
Figure 6.
Metabolites enriched in the Goat P2 pool. For each fraction, four samples were analyzed. Raw data (quantitative relative ion count) were normalized using the Pareto Scaling normalization and analyzed using the ANOVA test. Only metabolites enriched in the Bovine P2 fraction are reported (FDR p < 0.05). The normalized concentration is reported for each metabolite in the P1, P2, P3, P4, P5 pools. The solid line represents the median, the box reports the interquartile range and the whiskers reports the minimum and maximum value of the distribution. Each sample is represented by a grey point, outliers are reported using a black point.

