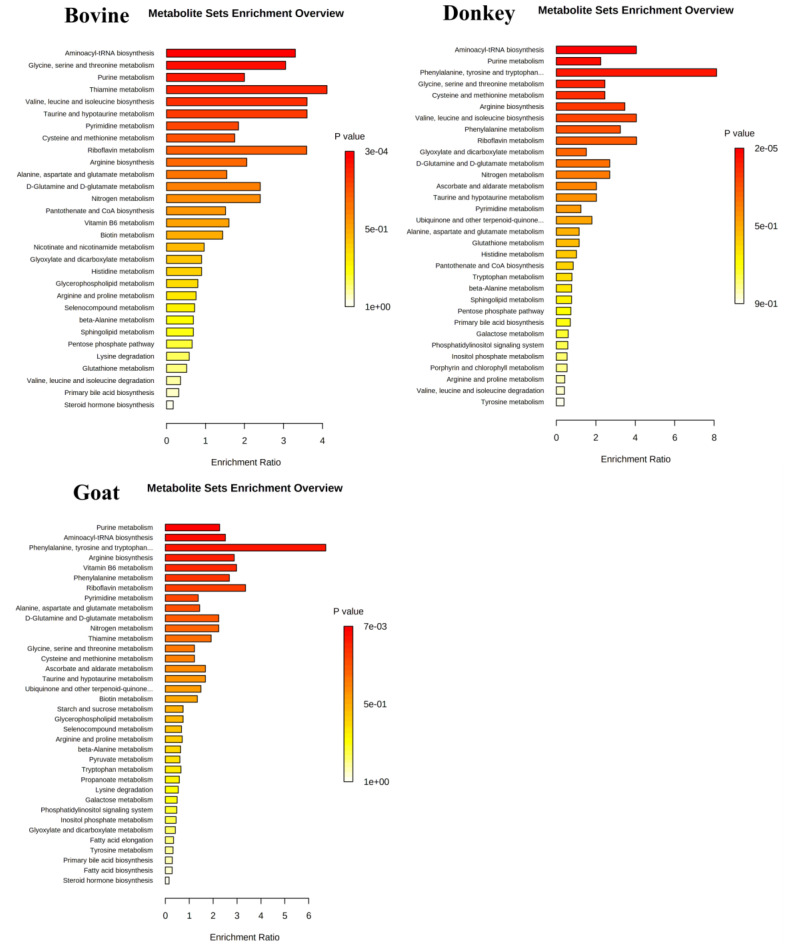
Figure 8.
Metabolite Set Enrichment Analysis (MSEA) overview obtained through MetaboAnalyst by plotting -log of p-values from pathway enrichment analysis on the y-axis and pathway impact values from pathway topology analysis on the x-axis. Color intensity (light yellow to red) reflects increasing statistical significance.

