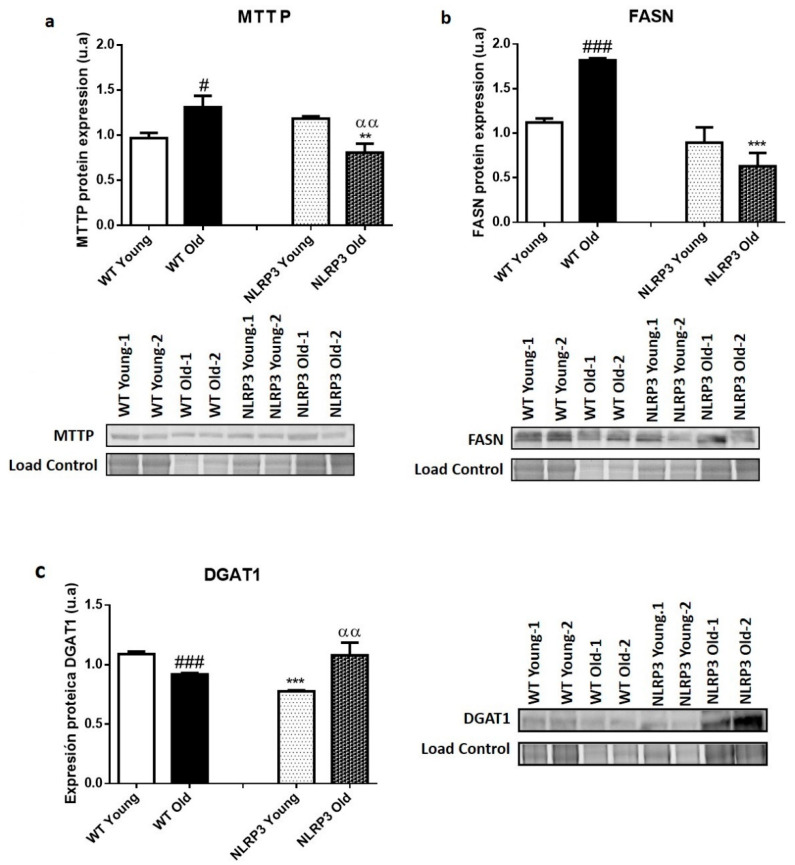
Figure 2.
Protein expression levels of lipid metabolism markers in the liver tissue samples of WT and NLRP3−/− mice. (a) MTTP (b) FASN (c) DGAT1. All data are shown as the means ± SEM (n = 8). ** p ≤ 0.01/*** p ≤ 0.001 (WT Young/Old vs. NLRP3 Young/Old); # p ≤ 0.05/### p ≤ 0.001 (WT Young vs. WT old); ααp ≤ 0.01(NLRP3 Young vs. NLRP3 old).

