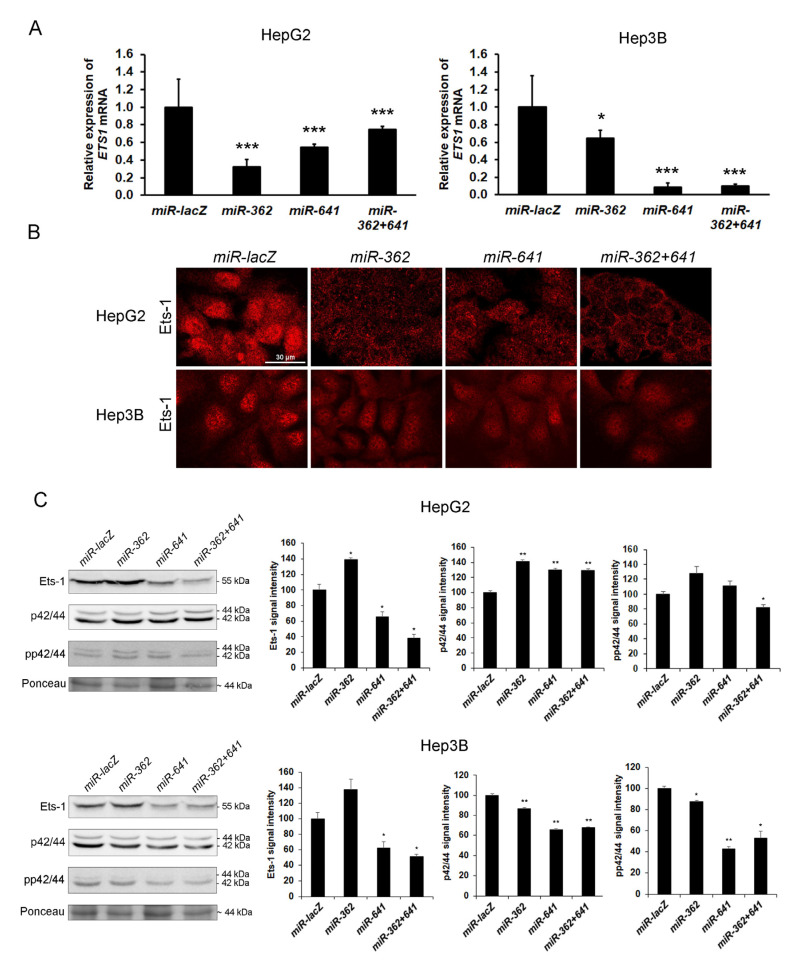
Figure 8.
Silencing of Ets-1 by RNA interference in HepG2 and Hep3B cells. (A) As indicated by the qRT-PCR results, knockdown of Ets-1 expression was successful in both cell lines; (B) The silencing constructs effectively hindered Ets-1 protein expression; (C) Except for miR-362, Western blots confirmed the downregulation of Ets-1; however, inactivation of ERK1/2 was mostly detected in Hep3B cell line. Data points represent the mean ± SD, (A) n = 3, (C) n = 2; * p < 0.05; ** p < 0.01; *** p < 0.001 versus miR-lacZ transfectant. Representative images are at 600× magnification (scale bar 30 μm).

