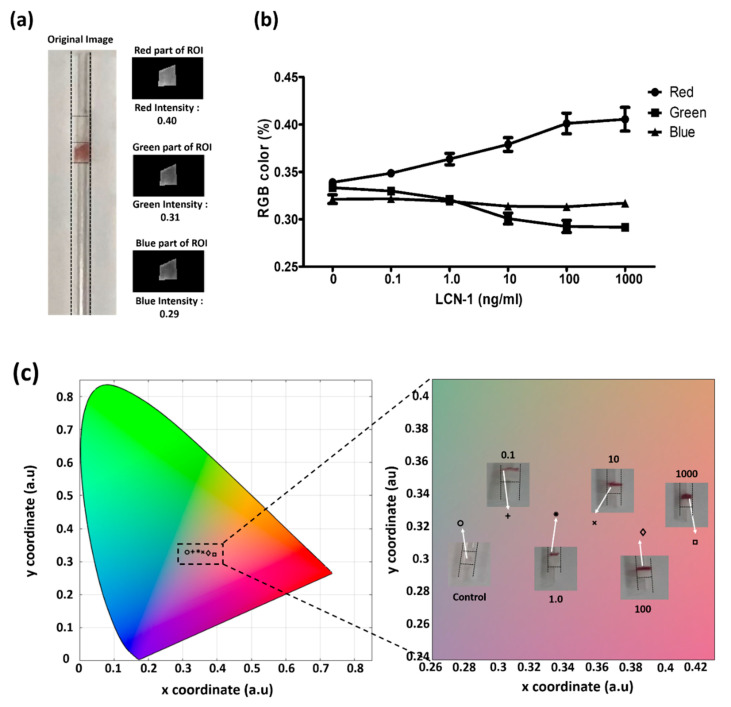
Figure 6.
(a) MATLAB interface for image processing for color profile; (b) percentage of RGB of the sandwiched immunocomplex at different antigen concentrations; (c) CIE 1931 color profile of aggregated sandwiched immunocomplex for visualization with the naked eye. The unit of the numbers in the insets is ng/mL.

