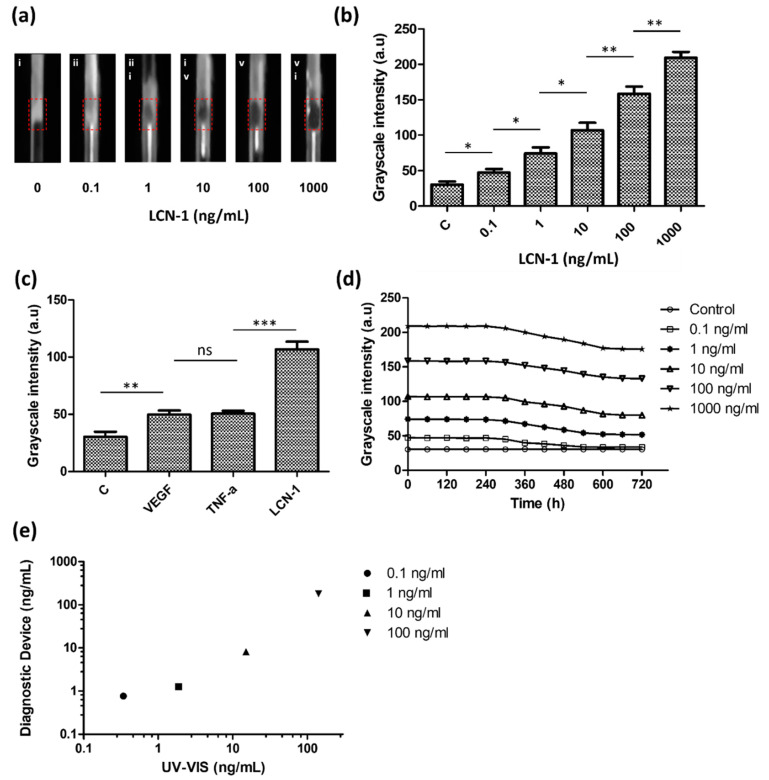
Figure 7.
Quantitative assessment of the detection platform: (a) grayscale images of diagnostic tool inside the detection box; (b) calibration of the grayscale intensity of sandwiched immunocomplex with respect to different lipocalin-1 (LCN-1) concentrations ranging from 100 pg/mL to 1 µg/mL; (c) binding specificity of the capture and probe particles in the presence of different antigens; (d) binding stability of sandwiched immunocomplex with respect to different times; (e) reliability of the detection platform. Comparison of LCN-1 concentration detection results between the proposed diagnostic tool and spectrophotometer. The symbols “*”, “**”, “***”, “ns” denote p < 0.05, p < 0.01, p < 0.001, and p > 0.05, respectively, under student’s t test (n = 5). The error bars represent standard deviation.

