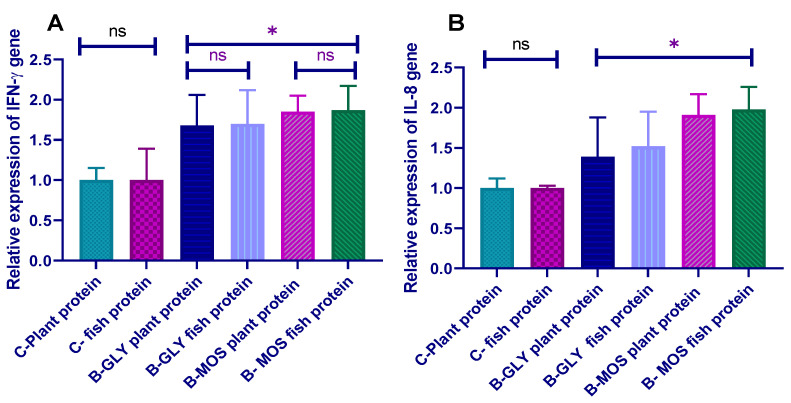
Figure 2.
Effect of dietary protein source and carbon source on proinflammatory cytokine (A) IFN-γ: interferon gamma and (B) IL-8: interleukin-8) expression profile in Nile tilapia prechallenge (data are expressed as mean ± SEM). * Bars with an asterisk correspond to values that are significantly different (Tukey, p < 0.05); ns Bars with (ns) correspond to values that are not significantly different.

