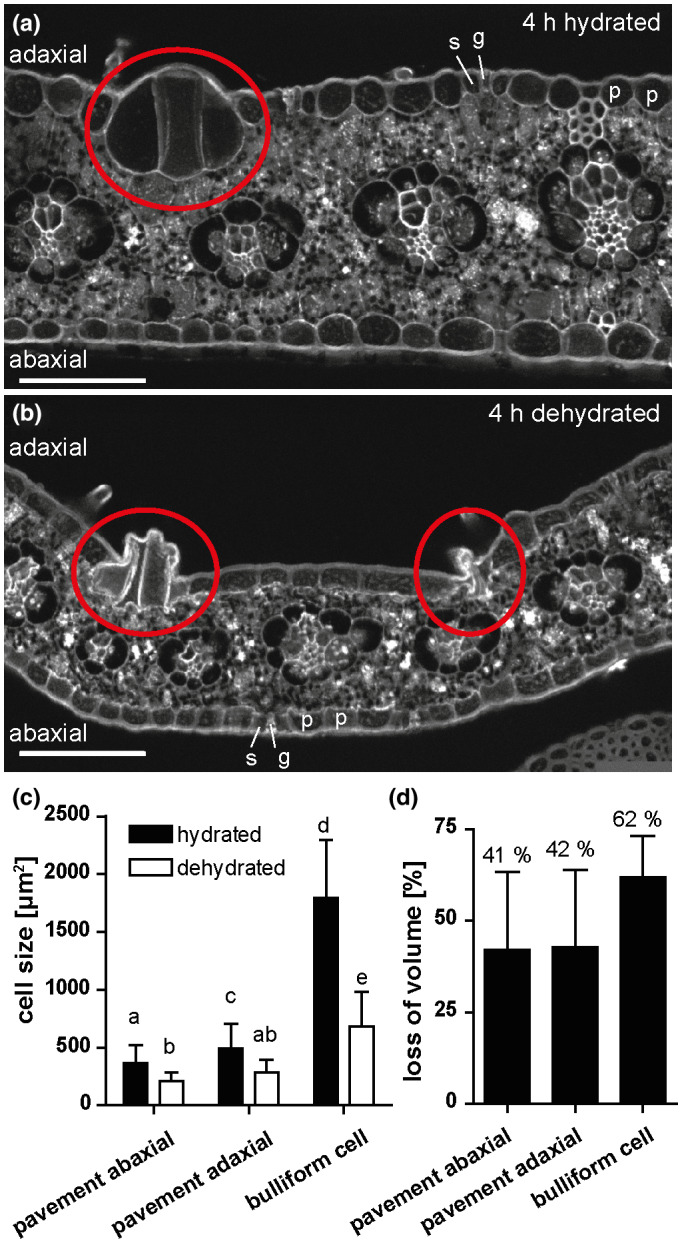
FIGURE 1.

Bulliform cells show increased shrinkage upon dehydration. (a‐b) Cross‐sections of (de‐)hydrated maize leaf tissue after 4 hr in the dark. Tissue was shock‐frozen after 4 hr without fixation, and autofluorescence was detected by in situ‐cryo‐imaging as described in Methods. p = pavement cell, g = guard cell, s = subsidiary cell, red circle = group of bulliform cells. Scale bar = 100 µm. (c) Cell sizes (cross‐sectional areas) of the indicated epidermal cell types, analyzed by ImageJ. (d) Quantification of cell shrinkage of different cell types upon dehydration as loss of volume in percentage. Shrunken bulliform cells were counted only if their outlines could be seen as in the group on the left in B (i.e. severely shrunken bulliform groups such as the one on the right in (b) were not counted). Values given as means + SD (n = 88–194 cells per cell type). Statistical analysis used 1‐way ANOVA, means with the same letter are not significantly different from each other; Tukey's post‐test, p < .05
