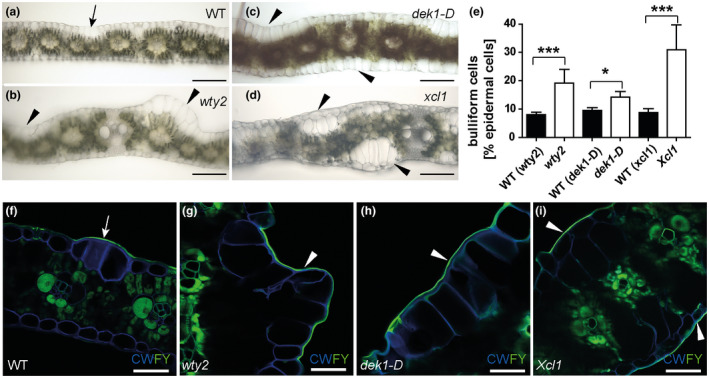
FIGURE 4.

Three different epidermal mutants have increased bulliform cell coverage. (a‐d) Bright field images of hand‐sectioned adult leaves from the indicated genotypes depict previously reported aberrations in epidermal cell types. Arrow = wild‐type‐like bulliform strip (2 cells wide), arrowhead = areas with abnormal bulliform‐like cells. Scale bar = 200 µm. (e) Quantification of bulliform cell number in three bulliform mutants as percentage of all epidermal cells, calculated using (f‐i) Fluorol Yellow stained tissue cross section images. FY = Fluorol Yellow (lipid stain; green), CW = Calcofluor White (cell wall counter stain; blue). White arrow = FY staining of wild‐type‐like bulliform strip cuticle (3 cells wide), white arrowhead in (g‐i) = areas with abnormal BC‐like cells displaying increased FY staining of the cuticle. Scale bar = 50 µm. Values in (e) are given as means + SD (n = 300–380 epidermal cells counted, four biological replicates per genotype). Statistical analysis used two‐tailed unpaired Student's t‐test, with *p < .05, ***p < .001
