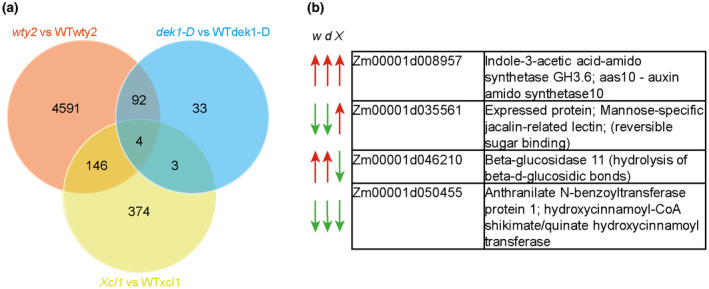
FIGURE 10.

Transcriptomic analysis of the cuticle maturation zone in bulliform‐enriched mutants. (a) Venn diagram depicts overlap of differentially expressed genes (DEGs) for all three bulliform mutants. (b) Gene identifiers and putative gene function of four DEGs identified in all three bulliform mutant comparisons. w = wty2, d = dek1‐D, and X = Xcl1, red arrow = gene expression is increased. green arrow = gene expression is decreased in the respective mutant
