
Figure 1.
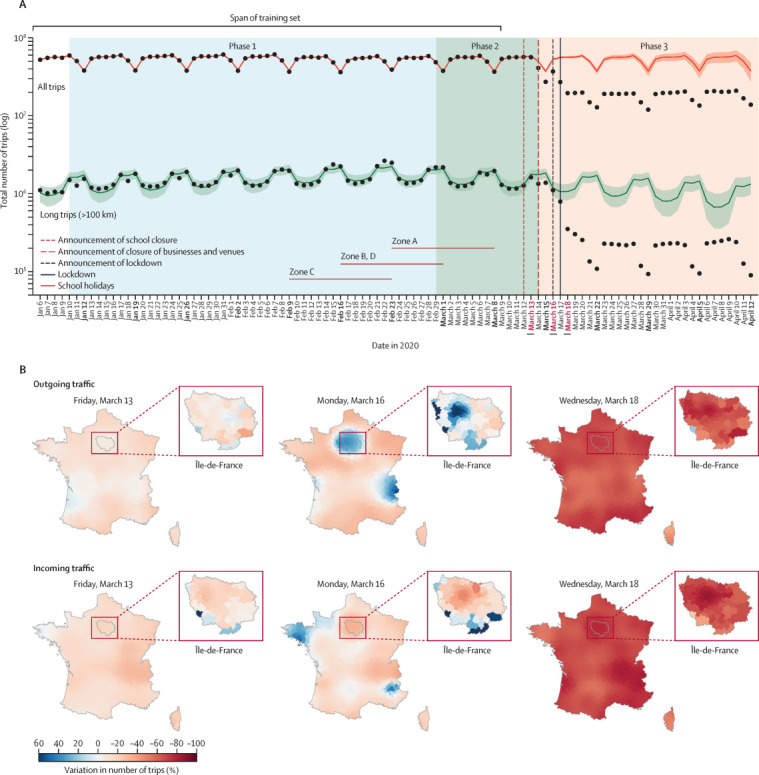
Phases of the COVID-19 epidemic in France, and its effect on mobility patterns
(A) Coloured areas correspond to the different phases of the epidemic response, and red lines mark main government interventions; zones A–D are four government-defined geographical areas of France (Paris is in zone C); dashed vertical lines indicate announcements made by French authorities; school closures were to be implemented starting March 16; the announcement of closure of non-essential businesses was done with immediate effect; the announcement of lockdown was done on March 16, to be implemented the day after at noon, and the black solid vertical line on March 17, 2020, indicates the beginning of lockdown; the black dots track the temporal change of the total number of daily trips measured from mobile phone data in France from Jan 6 to April 12; each timeline is fitted with the training set (thin lines) going from Jan 6 to March 9, with extrapolation up to April 12; shaded areas represent 95% credibility intervals. (B) Maps show the variation in incoming and outgoing traffic compared with the unperturbed baseline predicted by the fit; the chosen dates were March 13, March 16 (day before lockdown), and March 18 (day after lockdown enforcement).