
Figure 2.
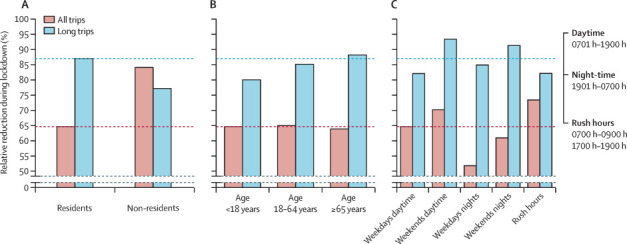
Mobility reduction during lockdown across user type, age, and time of day
Reduction was computed as the mean over the week starting Monday, April 6, 2020, with respect to the mean over the first week of February (starting Feb 3). Relative reduction was broken down by residency status (A), age class (B), and time of day (C) and assessed for all trips and for long trips (>100 km). Horizontal dashed lines indicate relative reduction on all residents for all trips and for long trips.