
Figure 5.
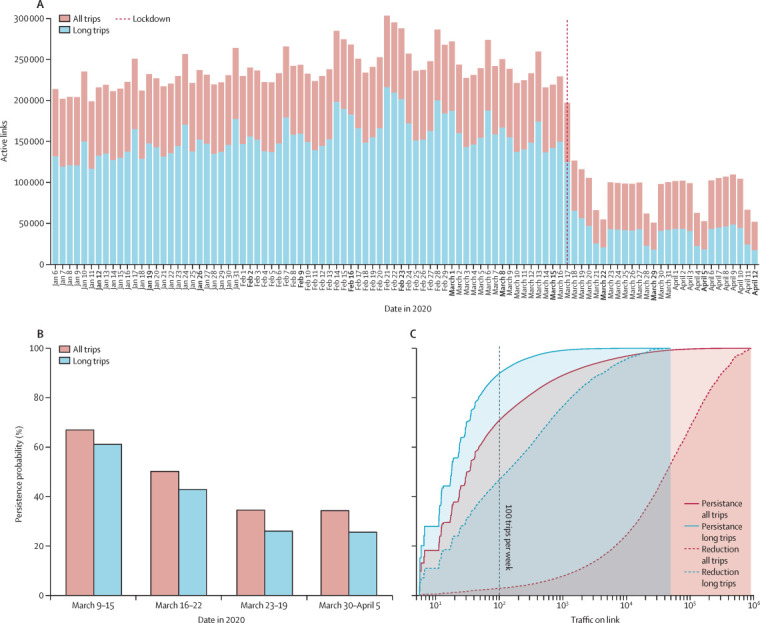
Network analysis
(A) Number of mobility connections between French locations over time. (B) Link persistence probability, defined as the probability that a connection present during week Feb 3–9 was still present in one of the four selected weeks: before lockdown (March 9–15), during enforcement (March 16–22), and during lockdown (March 23–29 and March 30 to April 5). (C) Persistence probability and traffic reduction in relation with traffic; for a given value of traffic on link, solid lines measure the portion of broken links that used to have, at most, that weight in the baseline week; dashed lines report the portion of missing traffic that was lost on connections that used to have, at most, a certain weight in the baseline week.