
Figure 6.
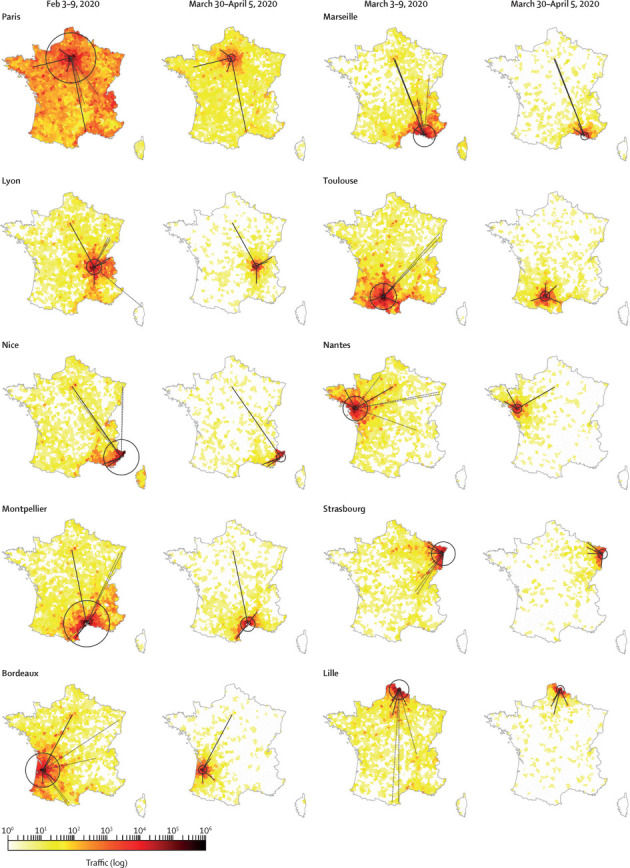
Outgoing egocentric networks of the ten most populated cities in France during baseline week (starting Feb 3, 2020) and during lockdown week, starting March 30
Locations are coloured by incoming traffic from the selected city. Solid lines indicate links that persisted during lockdown. Dashed lines are links that disappeared. Both types of locations were selected to be the top ranked by traffic during the baseline week. The circles contain 95% of the outgoing traffic from the respective city.