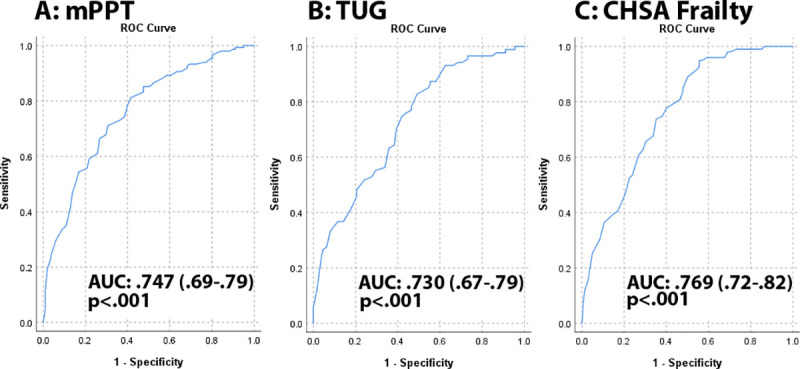
Fig 2. Receiver operator characteristics curve for QPAR.

We tested the ability of the QPAR to discriminate between individuals with impaired physical functionality (mPPT), falls risk (TUG) and the presence of frailty (CHSA rating). Panel A: The QPAR demonstrated good discrimination between normal and impaired physical functionality as determined by mPPT scores with an AUC 0.747 (95%CI: 0.69–0.79, p < .001). Panel B: The QPAR showed good discrimination between low and increased falls risk determined by TUG times with an AUC 0.730 (95% CI: 0.67–0.79, p < .001). Panel C: The QPAR demonstrated good discrimination between individuals with and without frailty by CHSA staging with an AUC 0.769 (95% CI: 0.72–0.82, p < .001).
