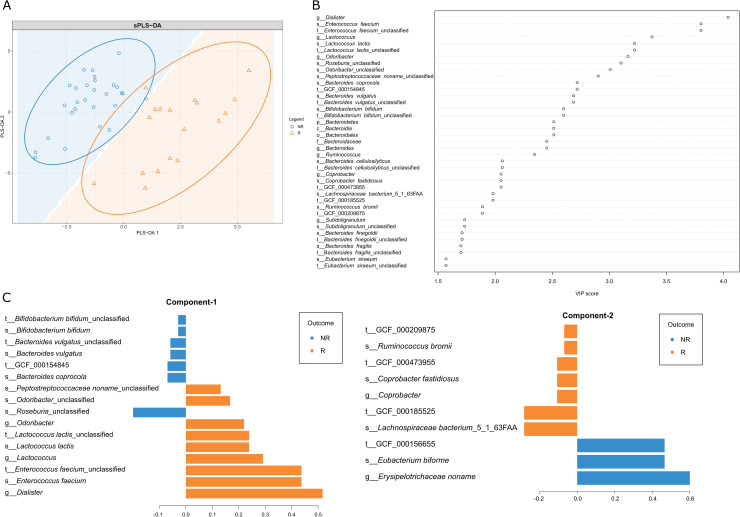
Fig 5. Sparse Partial Least Squares Discriminant Analysis (sPLS-DA) of OPTIMED cohort subgroups at M0 time point.
(A) Sample plot depicting the first two sPLS-DA components with 95% confidence level ellipse plots. The background coloring describes the predicted area for each class, defined as the 2D surface where all points are predicted to be of the same class. Samples and subgroups coded as follows: R–Responders, orange triangles; NR–Non-Responders, blue circles. (B) VIP (variable importance projection) score dot-chart classified by sPLS-DA. Depicted taxonomic groups with VIP≥1.5 in the first component. (C) The contribution of each taxonomic group on the first and second components, the length of the bar represents the importance of each feature to the component (importance from bottom to top). Colors indicate the patient subgroup (NR (blue) vs R (orange)) in which the taxonomic group is most abundant.

