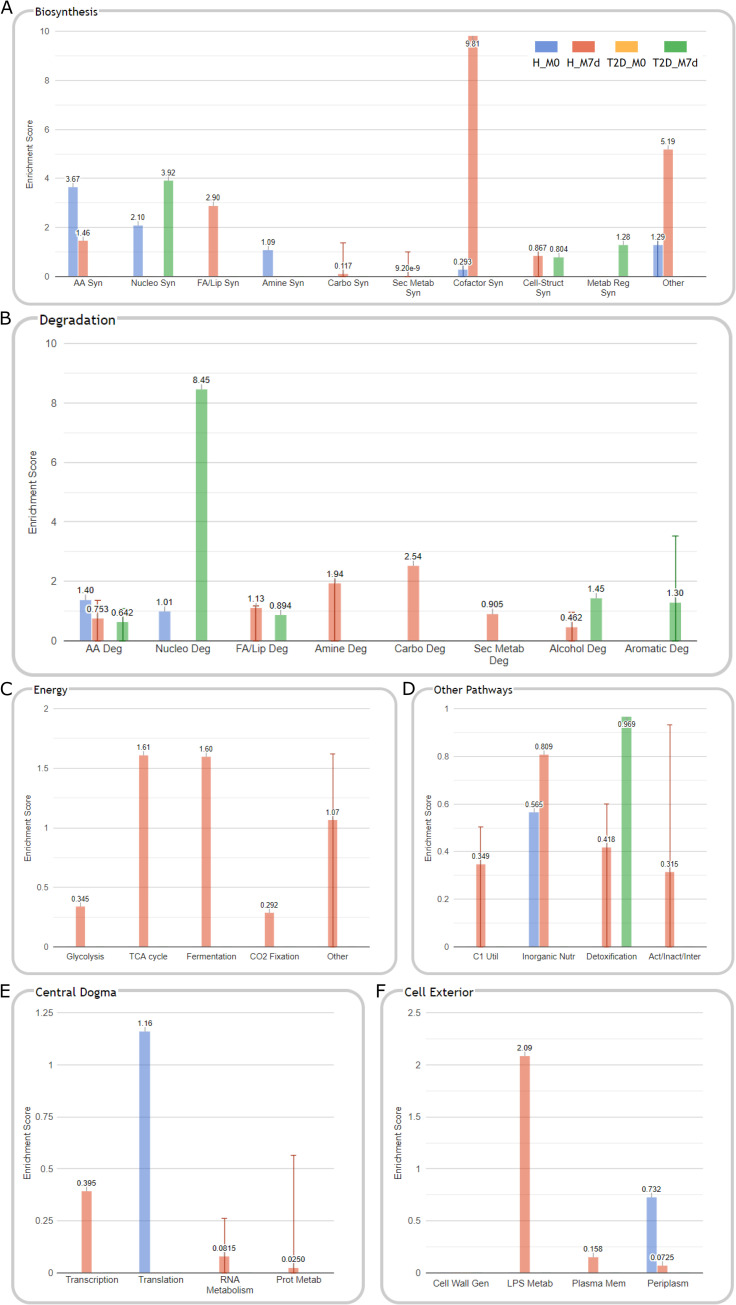
Fig 6. Cellular function enrichment analysis comparing functional profiles before and after 7 days long metformin therapy both in the OPTIMED cohort and in healthy individuals.
Respectively, H_M0 (blue) and T2D_M0 (yellow) results represent data on pathways and functions reduced during metformin therapy and H_M7d (red) and T2D_M7d (green) – pathways and functions increased, only significant (p<0.05) enrichment categories are shown. Enrichment results are depicted in the following set of functional panels: (A) Biosynthesis, (B) Degradation, (C) Energy, (D) Other pathways, (E) Central dogma, (F) Cell exterior. Groups marked as follows: H–healthy individuals; T2D – type 2 diabetes patients. Samples: M0—before starting metformin treatment; M7d –after 7 days treatment with metformin. Pathway abbreviations: (A) AA Syn – amino acid biosynthesis; Nucleo Syn – nucleoside and nucleotide biosynthesis; FA/Lip Syn–fatty acid and lipid biosynthesis; Amine Syn–amine and polyamine biosynthesis; Carbo Syn – carbohydrate biosynthesis; Sec Metab Syn–secondary metabolite biosynthesis; Cofactor Syn–cofactor, carrier, and vitamin biosynthesis; Cell-Struct Syn–cell structure biosynthesis; Metab Reg Syn–metabolic regulator biosynthesis. (B) AA Deg–amino acid degradation; Nucleo Deg–nucleoside and nucleotide degradation; FA/Lip Deg–fatty acid and lipid degradation; Amine Deg–amine and polyamine degradation; Carbo Deg –carbohydrates and carboxylates degradation; Sec Metab Deg–secondary metabolite degradation; Alcochol Deg–alcohol degradation; Aromatic Deg–aromatic compound degradation. (D) C1 Util–C1 compound utilization and assimilation; Inorganic Nutr – inorganic nutrient metabolism; Act/Inact/Inter—Activation/Inactivation/Interconversion. (E) Prot Metab–protein metabolism. (F) Cell Wall Gen–cell wall biogenesis/organization proteins; LPS Metab – Lipopolysaccharide Metabolism Proteins; Plasma Mem–plasma membrane proteins; Periplasm–periplasmic proteins.

