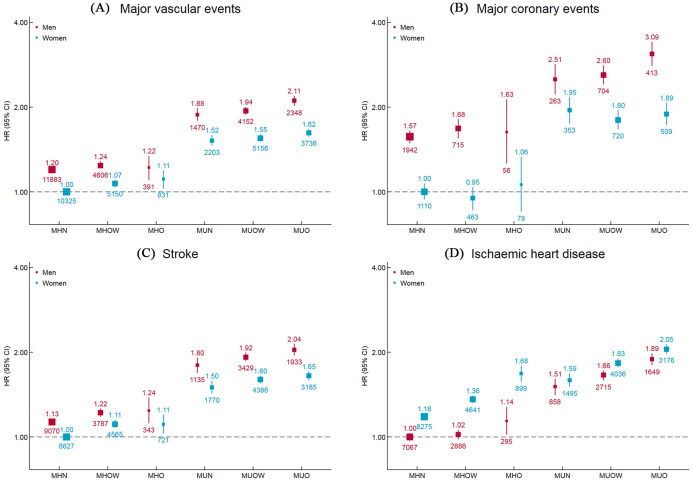
Fig 3. Adjusted HRs for cardiovascular diseases subtypes by BMI-metabolic health status and sex.
Values shown are the HR (95% CI) for (A) major vascular events, (B) major coronary events, (C) stroke, and (D) ischemic heart disease, by BMI-metabolic health status and sex. HRs are adjusted for age, study region, education, household income, marital status, smoking, alcohol use, red meat intake, fresh fruits intake, fresh vegetables intake, physical activity, and family history of heart attack or stroke. The vertical lines indicate 95% CIs. The values above the squares indicate HRs and the values under the squares indicate number of cases in each category. The size of the squares is proportional to the inverse variance of each effect size. BMI, body mass index; CI, confidence interval; HR, hazard ratio; MHN, metabolically healthy normal weight; MHO, metabolically healthy obesity; MHOW, metabolically healthy overweight; MUN, metabolically unhealthy normal weight; MUO, metabolically unhealthy obesity; MUOW, metabolically unhealthy overweight.

