
Fig 2. Expression of cCENH3 gene.
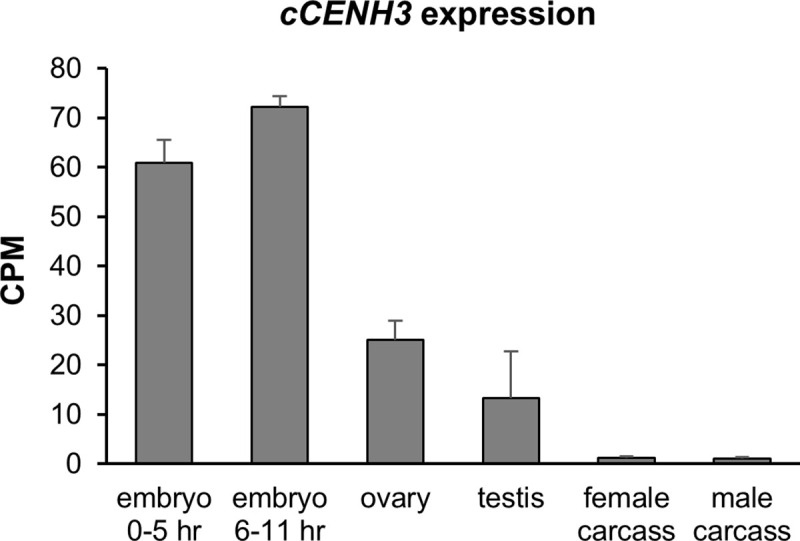
The expression profiles of cCENH3 gene in embryos (0–5 hr and 6–11 hr), germline (ovary, testis) and somatic tissues (female and male carcasses without gonads) were obtained from the original RNA-seq datasets from Khan et al. [29]. Transcript hits were normalized using CPM method. Error bars represent standard deviation calculated from two (testes) or three (all the other samples) biological replicates. Data on cCENH3 transcript hits are provided in S2 Appendix.