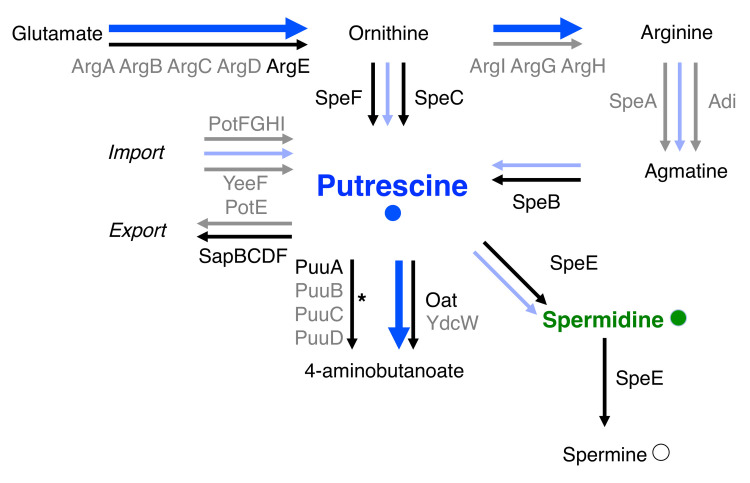
Fig 1. The putrescine biosynthetic and degradative pathways in S. Typhimurium and E. coli.
Black and gray arrows represent biochemical reactions carried out by the protein(s) indicated next to them. Black letters indicate proteins investigated in this work, gray letters indicate other proteins related to putrescine abundance. Some intermediate metabolites are omitted for clarity. Blue arrows denote changes in the expression of genes mediating putrescine import, export, biosynthesis or degradation resulting from growth of S. Typhimurium in different Mg2+ concentrations as measured by the RNA-seq experiment discussed below (Table 1). Bold blue arrows denote pathways upregulated during growth in 10 mM Mg2+ compared to 0.8 mM Mg2+. Slim light blue arrows denote pathways downregulated during growth in 10 mM Mg2+ compared to 0.8 mM Mg2+. *: the PuuABCD pathway is present in E. coli but not in S. Typhimurium.

