
Fig 3. Proportion and the protein expression of MyHC isoforms in CON (n = 5) and KD (n = 5).
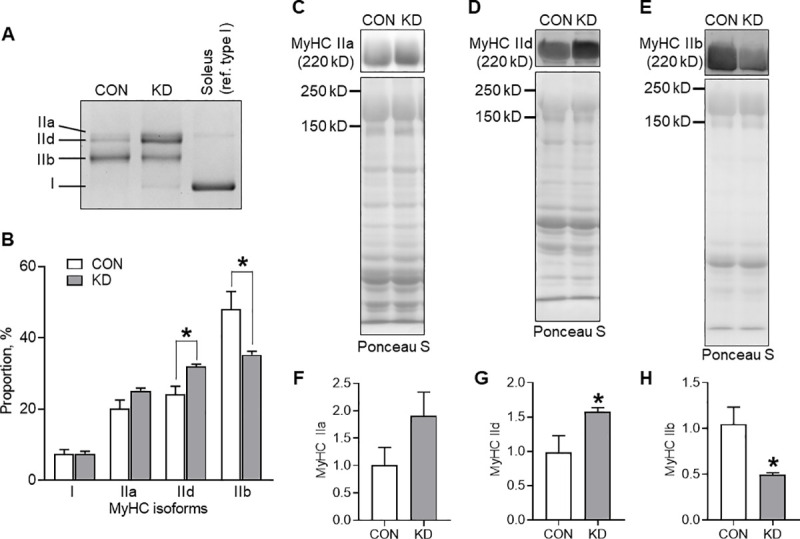
(A) A representative image of the separation. Soleus was used for a reference of type I isoform. (B) Relative proportion of MyHC isoforms presented with representative images of the protein band and transferred protein of MyHC type IIa (C), IId (D), and IIb (E). Protein expressions of MyHC type IIa (F), IId (G), and IIb (H). * Significant difference was found between CON and KD. Values are expressed as means ± S.E.M.