
Fig 5. Protein expression of Sema3A in CON (n = 5) and KD (n = 5).
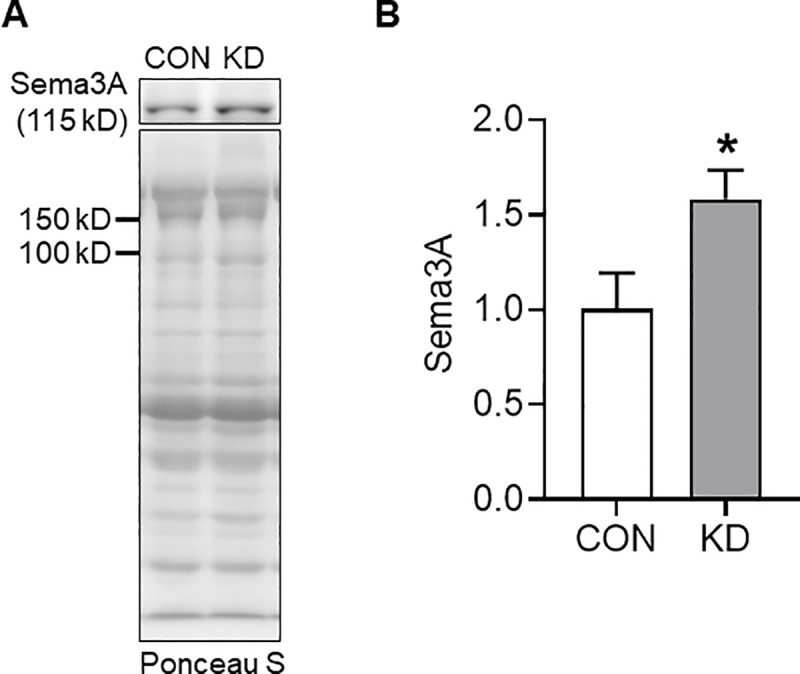
Representative images of the protein band and transferred protein (A) The protein expression of Sema3A (B). *Significant difference was found between CON and KD. Values are expressed as means ± S.E.M.