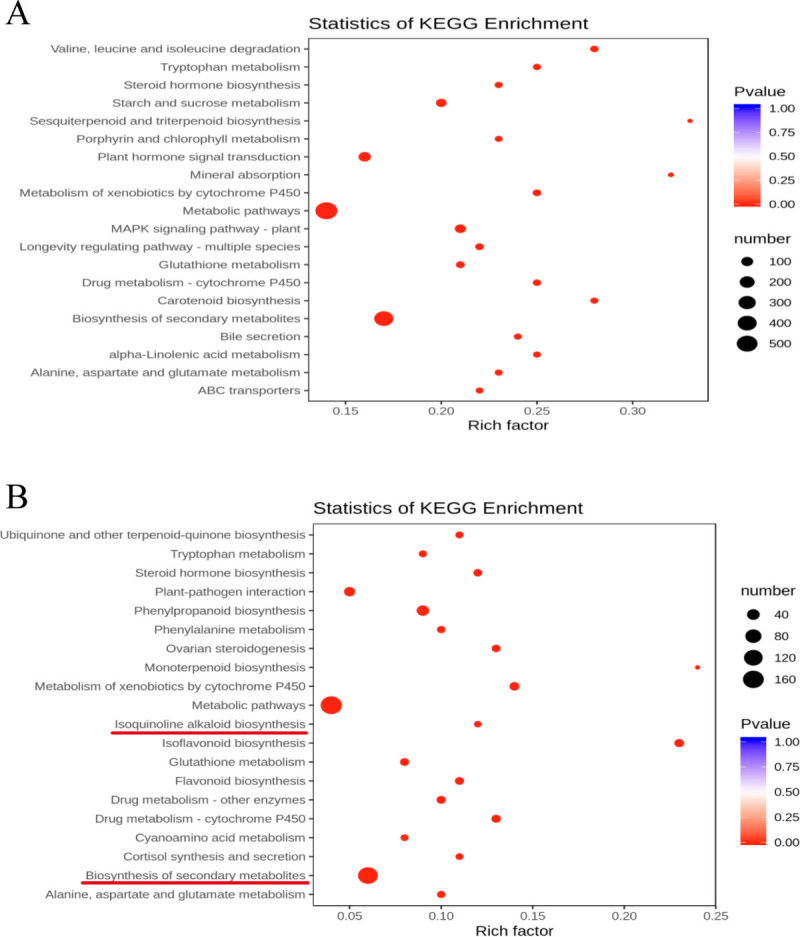
Fig 2.

Bubble diagrams of KEGG pathway enrichment for DEGs in (A) WW/D and (B) D/D-M comparison. The rich factor is calculated as the DEGs number divided by the base number of any given pathway. Dot size denotes the number of genes, and dot color denotes the range of adjusted P-value.
