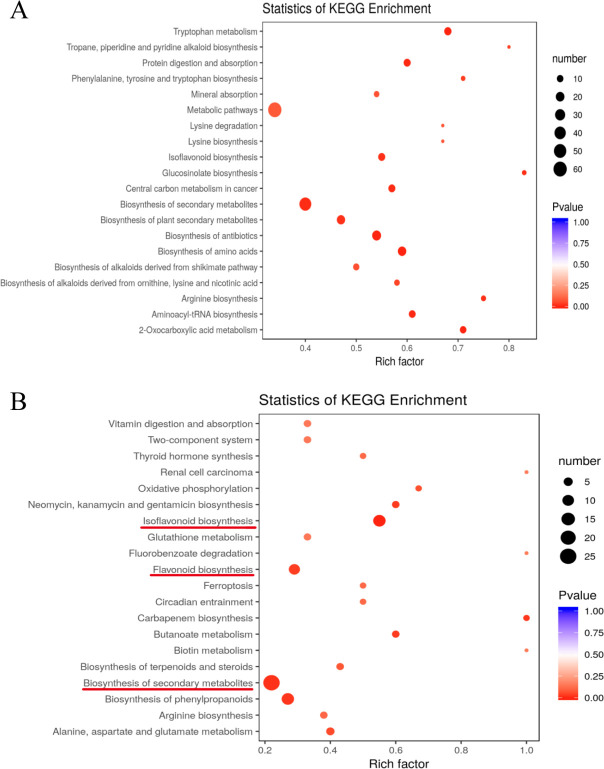
Fig 3.
Bubble diagrams of KEGG pathway enrichment for differentially-accumulated metabolites in (A) WW/D and (B) D/D-M comparison. The rich factor is calculated as the number of differentially-accumulated metabolites divided by the base number of any given pathway. Dot size denotes the number of differentially-accumulated metabolites, and dot color denotes the range of adjusted P-value.

