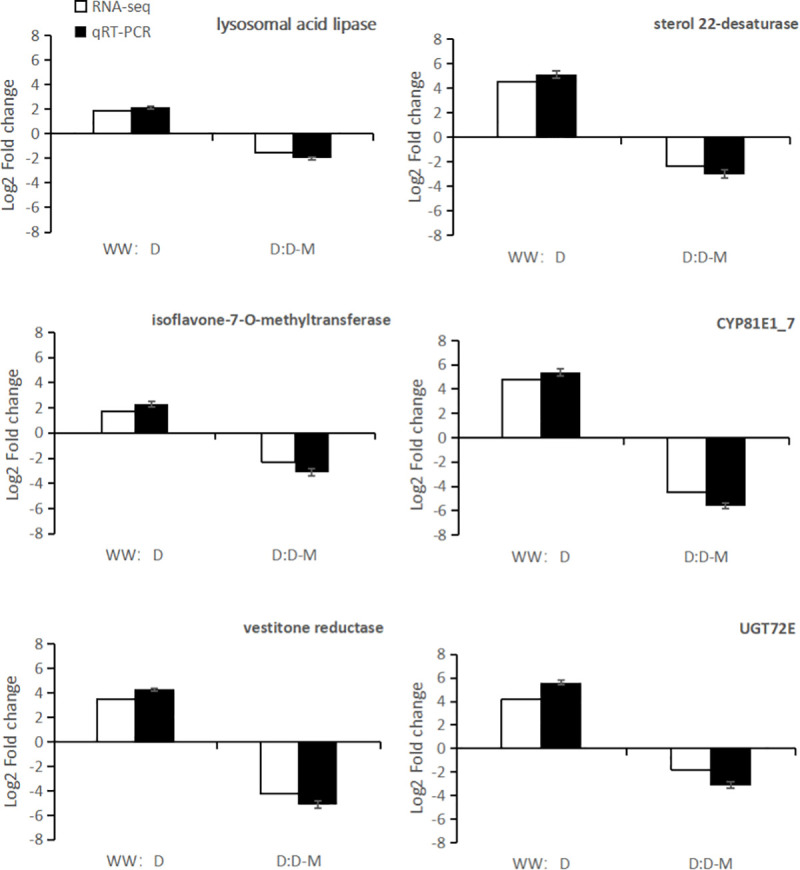
Fig 8. Validation of transcriptomic results by qRT-PCR.

The white bar signifies transcriptomic data for the DEGs, and the black bar denotes qRT-PCR results for the DEGs. The values were the means of three replicates of three different experiments.

The white bar signifies transcriptomic data for the DEGs, and the black bar denotes qRT-PCR results for the DEGs. The values were the means of three replicates of three different experiments.