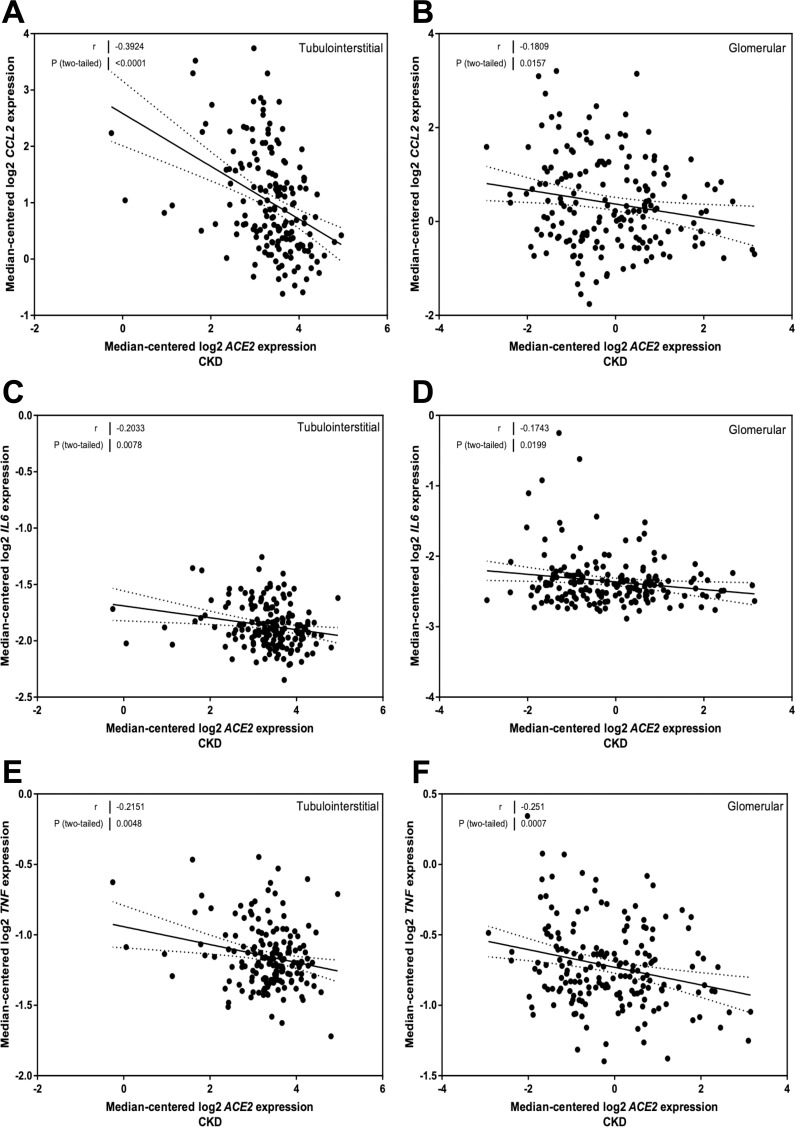
Fig 3. Correlation of tubular and glomerular Angiotensin-Converting Enzyme 2 (ACE2) mRNA expression with mRNA expression of inflammation genes in subjects with Chronic Kidney Disease (CKD).
(A, B) Correlation of monocyte chemoattractant protein 1 (MCP-1 or CCL2) expression with ACE2 mRNA expression in the (A) tubulointerstitium and (B) glomeruli. (C, D) Correlation of interleukin 6 (IL6) expression with ACE2 mRNA expression in the (C) tubulointerstitium and (D) glomeruli. (E, F) Correlation of tumor necrosis factor alpha (TNF) expression with ACE2 mRNA expression in the (E) tubulointerstitium and (F) glomeruli. Pearson’s correlation coefficient (r) with two-tailed P values were calculated. Linear regression was used to generate the line of best fit (solid lines) with 95% confidence intervals (dotted lines).

