Figure 2.
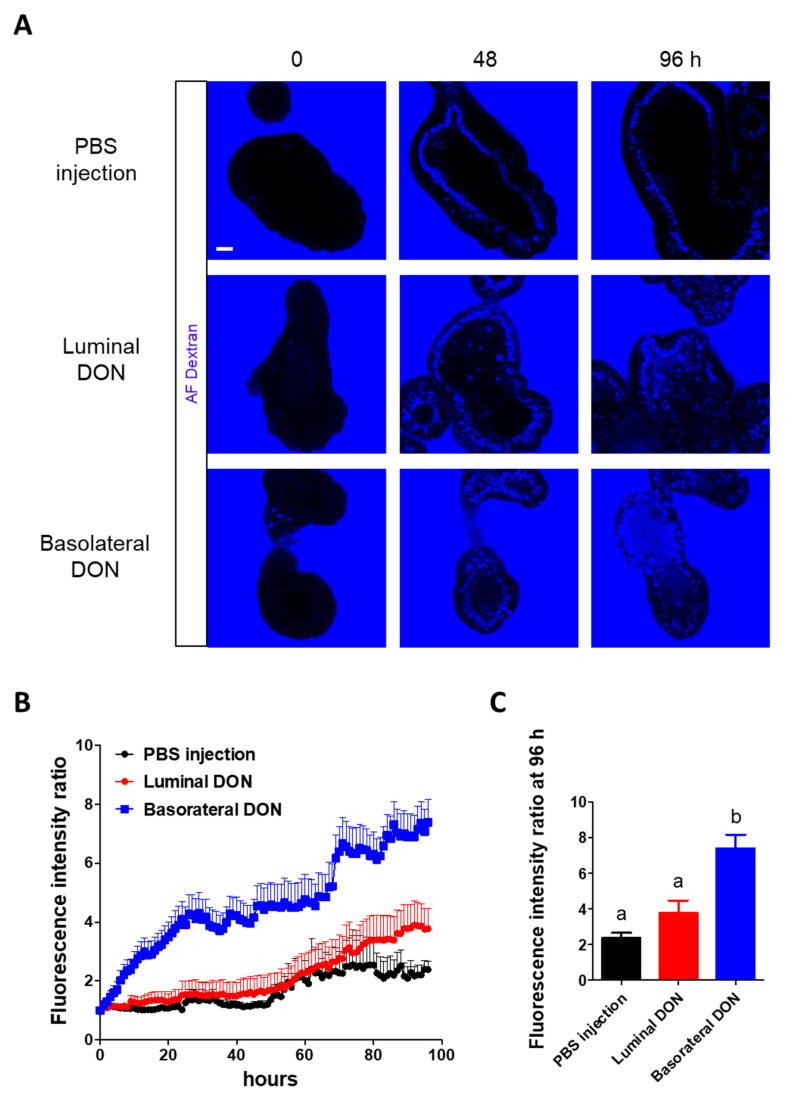
Effects of basolateral or luminal DON exposures on intestinal barrier functions. (A) Representative confocal images of enteroids with fluorescent dextran (blue) at 0, 48, and 96 h after treatments (phosphate-buffered saline (PBS) injection, 1-µM luminal DON exposure, or 1-µM basolateral DON exposure). Scale bar: 10 µm. (B) The time course of fluorescence intensity ratio of enteroids with fluorescent dextran. Mean ± standard error of the mean (SEM), n = 17–18. (C) Fluorescence intensity ratio of enteroids (black: Control, red: Luminal DON exposure, and blue: Basolateral DON exposure) at 96 h after treatments. Data were taken from Figure 2B. Mean ± SEM, n = 17–18. Different lowercase letters indicate significant differences (p < 0.05; Tukey′s post hoc test).

