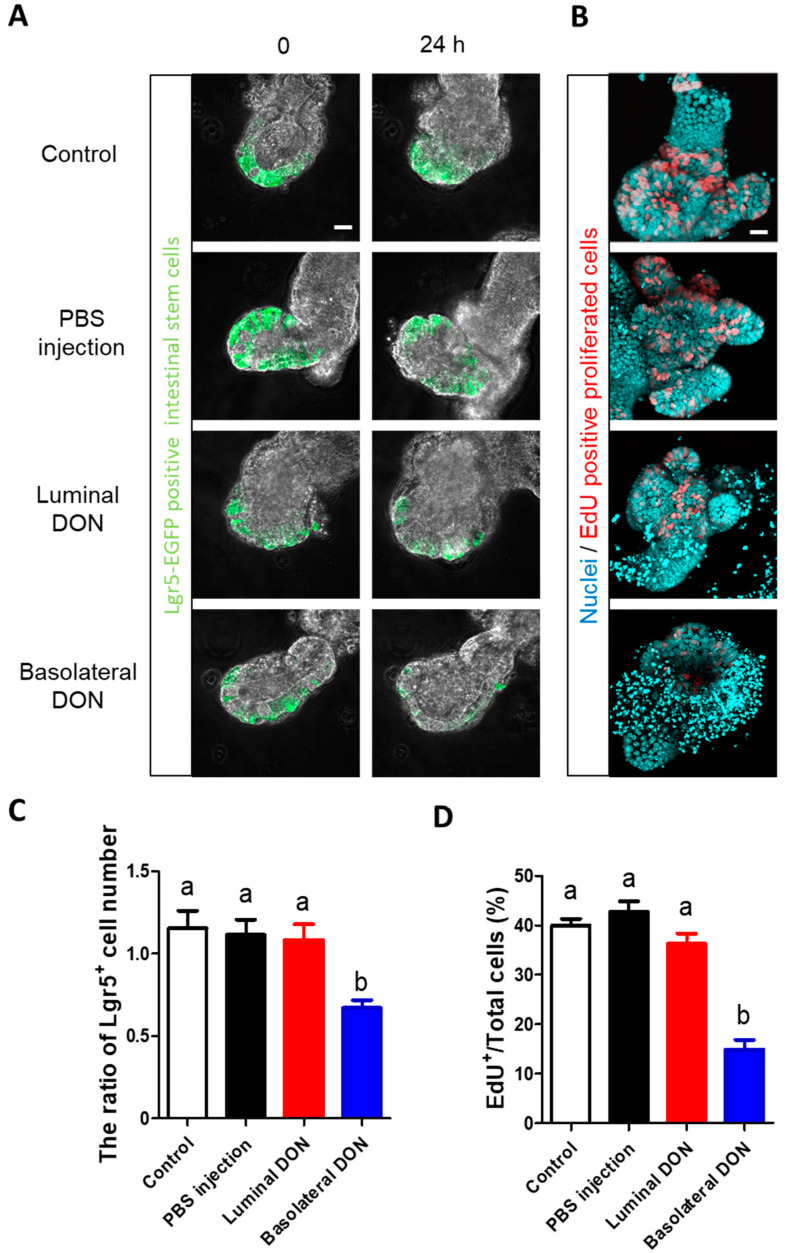
Figure 4.
Effects of basolateral or luminal exposures of DON on intestinal stem cells. (A) Representative confocal images of Lgr5-enhanced green fluorescence protein (EGFP) enteroids at 0 or 24 h after treatments (control, PBS injection, 1-µM luminal DON exposure, or 1-µM basolateral DON exposure). Lgr5-EGFP+ cells (green) shows Lgr5+ stem cells. (B) Representative confocal images of enteroids at 24 h after treatments. EdU+ cells (red) show proliferative cells and nuclei stained by Hoechst 33342 (sky blue). (C) The ratio of Lgr5+ cell numbers in enteroids at 24 h/0 h after treatments. Mean ± SEM, n = 8–16. (D) EdU+ cell quantification in enteroids at 24 h after treatments. The number of EdU+ cells was normalized with the number of total cells and expressed as EdU/total cells (%). Mean ± SEM, n = 16–22. Different lowercase letters indicate significant differences (p < 0.05; Tukey’s post hoc test). Scale bars: 20 µm.

