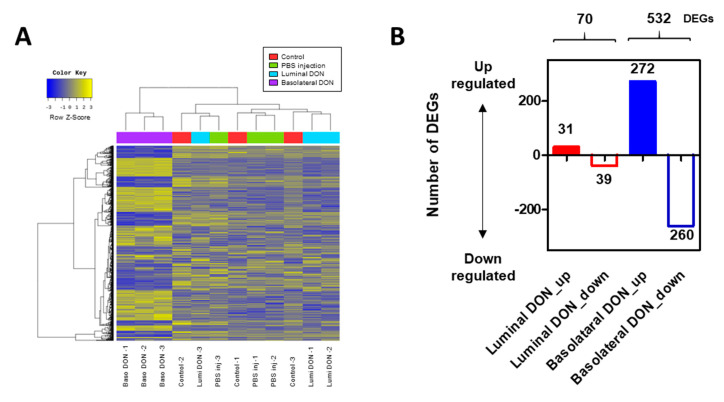
Figure 6.
RNA sequencing (RNA-seq) analysis of enteroids after the basolateral or luminal DON exposure. (A) Heat map of 888 differentially expressed genes (DEGs) identified through comparison among control enteroids, PBS-injected enteroids, and enteroids after luminal or basolateral DON exposure. (B) Distribution of up- or downregulated DEGs in enteroids after luminal and basolateral DON treatment analyzed through RNA-seq analysis.

