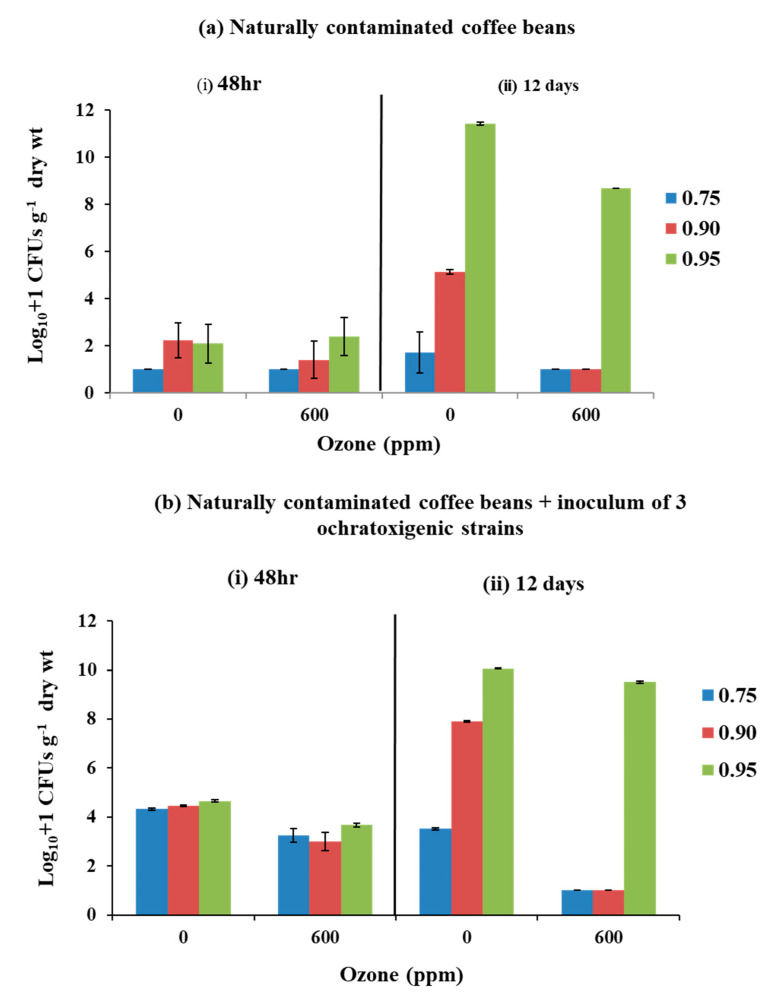
Figure 3.
Effect of air or 600 ppm O3 exposure for (600 ppm; 6 L min−1, 60 min) on the populations (log10 + 1 CFUs g−1 dry weight) isolated from (a) naturally contaminated coffee beans and (b) naturally contaminated + inoculum of condia of A. westerdijkiae, A. ochraceus, and A. carbonarius in coffee beans adjusted to 0.75, 0.90, and 0.95 aw, compared to the controls (0 ppm O3). (i) after exposure and (ii) 12 days storage at 30 °C. Vertical bars indicate the standard error of the means.

